gfrance is a SpatialPolygonsDataFrame object created with the
sp package, containing the polygon boundaries of the map of France as
it was in 1830, together with the Guerry data frame.
Format
The format is: Formal class 'SpatialPolygonsDataFrame' [package "sp"] with 5 slots:
gfrance@data,gfrance@polygons,gfrance@plotOrder,gfrance@bbox,gfrance@proj4string.
See: sp::SpatialPolygonsDataFrame() for descriptions of some
components.
The analysis variables, represented in gfrance@data are described in
Guerry.
Source
Friendly, M. (2007). Supplementary materials for Andre-Michel Guerry's Moral Statistics of France: Challenges for Multivariate Spatial Analysis, http://www.datavis.ca/gallery/guerry/.
References
Friendly, M. (2007). A.-M. Guerry's Moral Statistics of France: Challenges for Multivariable Spatial Analysis. Statistical Science, 22, 368-399.
Examples
library(sp)
data(gfrance)
names(gfrance) ## list @data variables
#> [1] "dept" "Region" "Department" "Crime_pers"
#> [5] "Crime_prop" "Literacy" "Donations" "Infants"
#> [9] "Suicides" "MainCity" "Wealth" "Commerce"
#> [13] "Clergy" "Crime_parents" "Infanticide" "Donation_clergy"
#> [17] "Lottery" "Desertion" "Instruction" "Prostitutes"
#> [21] "Distance" "Area" "Pop1831"
plot(gfrance) ## just show the map outline
 # Show basic choropleth plots of some of the variables
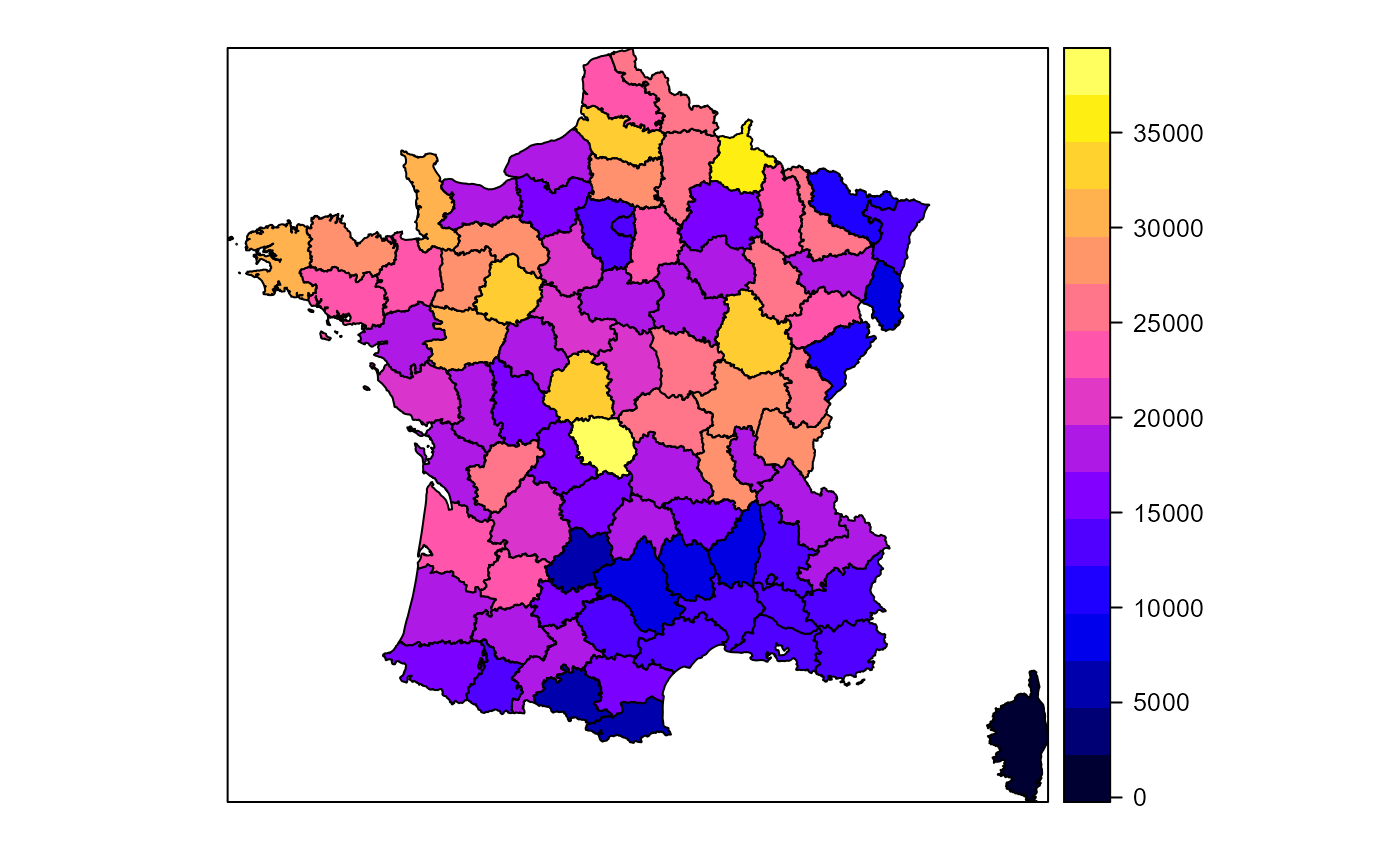
spplot(gfrance, "Crime_pers")
# Show basic choropleth plots of some of the variables
spplot(gfrance, "Crime_pers")
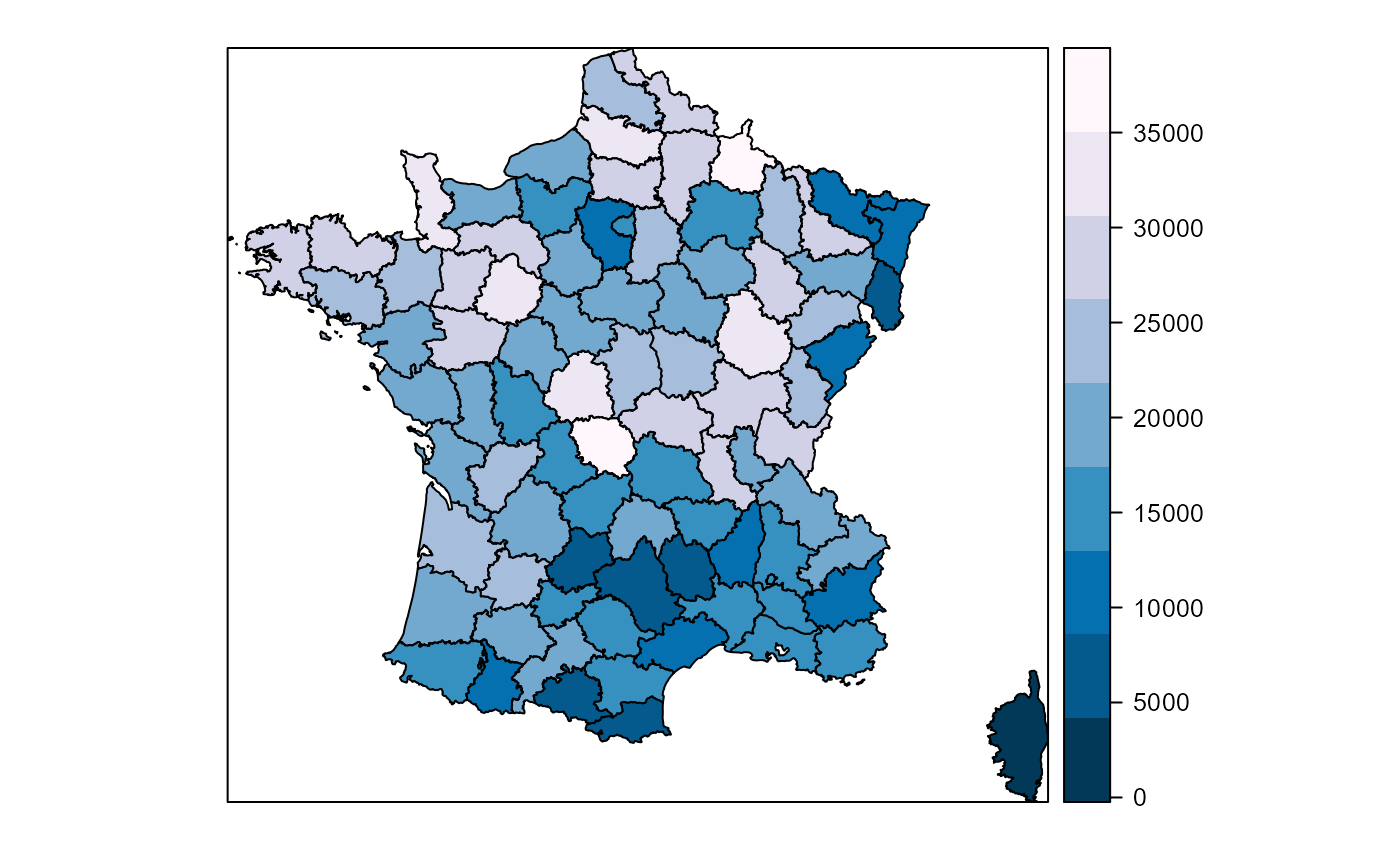
 # use something like Guerry's pallete, where dark = Worse
my.palette <- rev(RColorBrewer::brewer.pal(n = 9, name = "PuBu"))
spplot(gfrance, "Crime_pers", col.regions = my.palette, cuts = 8)
# use something like Guerry's pallete, where dark = Worse
my.palette <- rev(RColorBrewer::brewer.pal(n = 9, name = "PuBu"))
spplot(gfrance, "Crime_pers", col.regions = my.palette, cuts = 8)
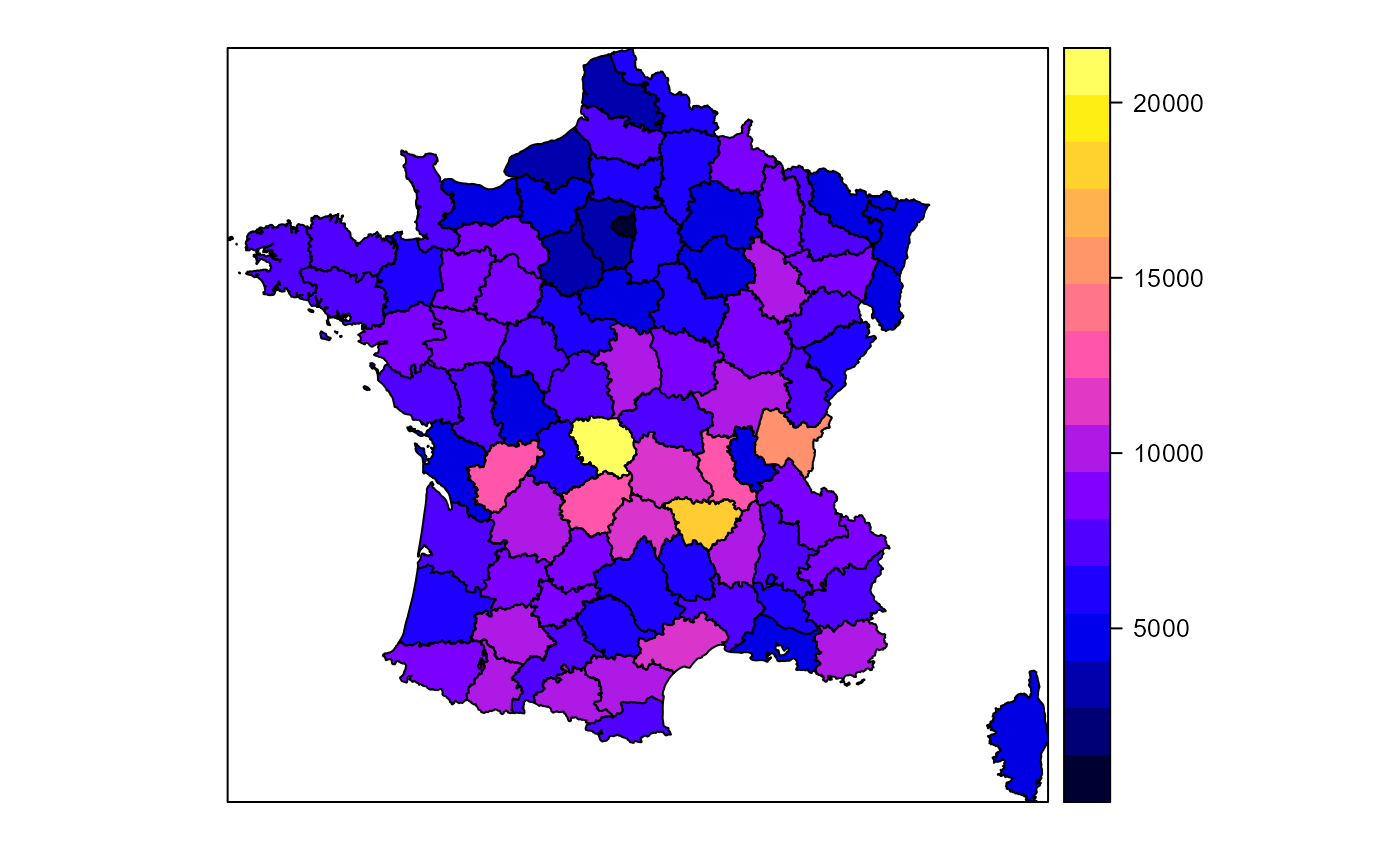
 spplot(gfrance, "Crime_prop")
 # Note that spplot assumes all variables are on the same scale for comparative plots
# transform variables to ranks (as Guerry did)
if (FALSE) { # \dontrun{
local({
gfrance$Crime_pers <- rank(gfrance$Crime_pers)
gfrance$Crime_prop <- rank(gfrance$Crime_prop)
gfrance$Literacy <- rank(gfrance$Literacy)
gfrance$Donations <- rank(gfrance$Donations)
gfrance$Infants <- rank(gfrance$Infants)
gfrance$Suicides <- rank(gfrance$Suicides)
spplot(gfrance, c("Crime_pers", "Crime_prop", "Literacy", "Donations", "Infants", "Suicides"),
layout=c(3,2), as.table=TRUE, main="Guerry's main moral variables")
})
} # }
# Note that spplot assumes all variables are on the same scale for comparative plots
# transform variables to ranks (as Guerry did)
if (FALSE) { # \dontrun{
local({
gfrance$Crime_pers <- rank(gfrance$Crime_pers)
gfrance$Crime_prop <- rank(gfrance$Crime_prop)
gfrance$Literacy <- rank(gfrance$Literacy)
gfrance$Donations <- rank(gfrance$Donations)
gfrance$Infants <- rank(gfrance$Infants)
gfrance$Suicides <- rank(gfrance$Suicides)
spplot(gfrance, c("Crime_pers", "Crime_prop", "Literacy", "Donations", "Infants", "Suicides"),
layout=c(3,2), as.table=TRUE, main="Guerry's main moral variables")
})
} # }