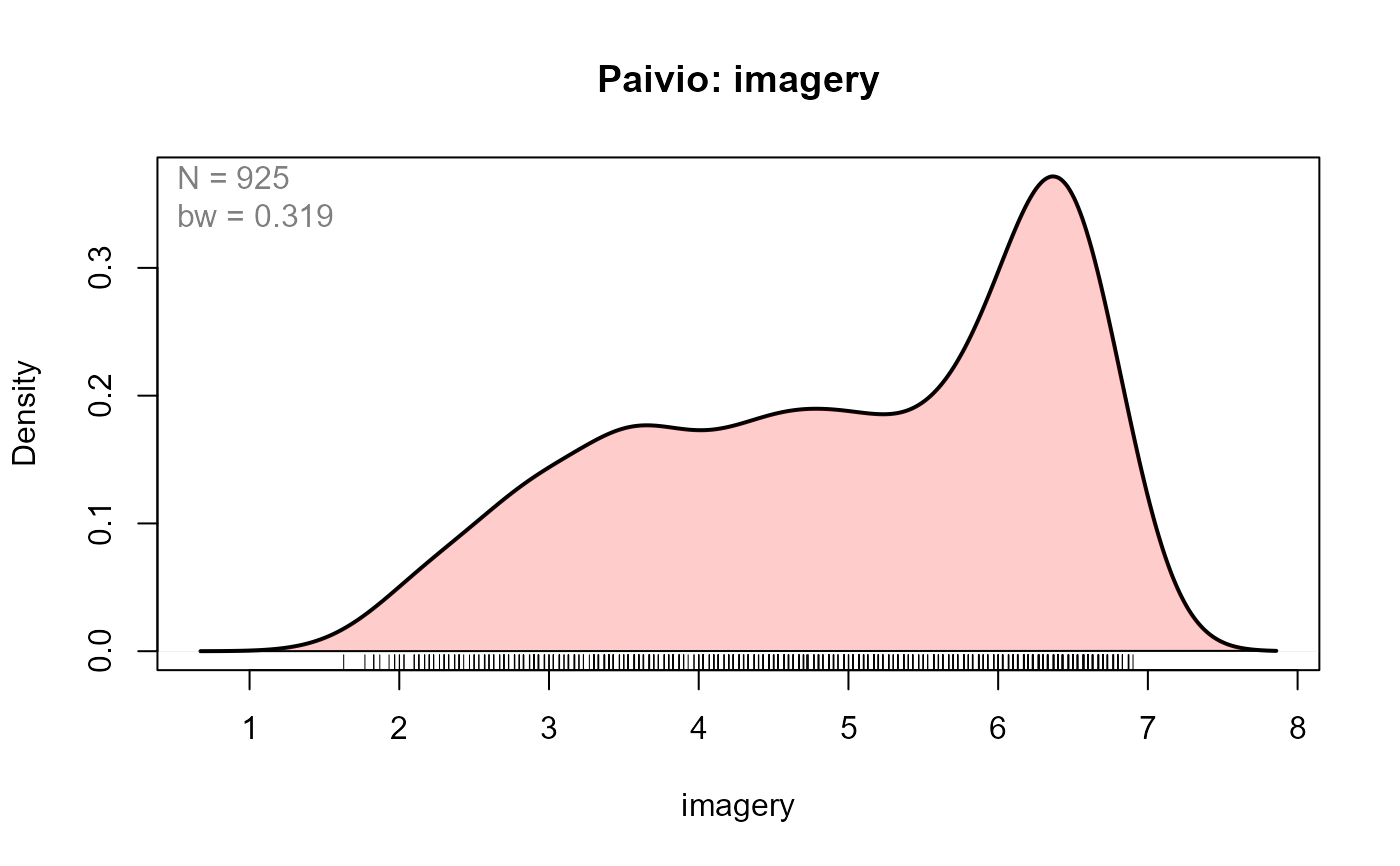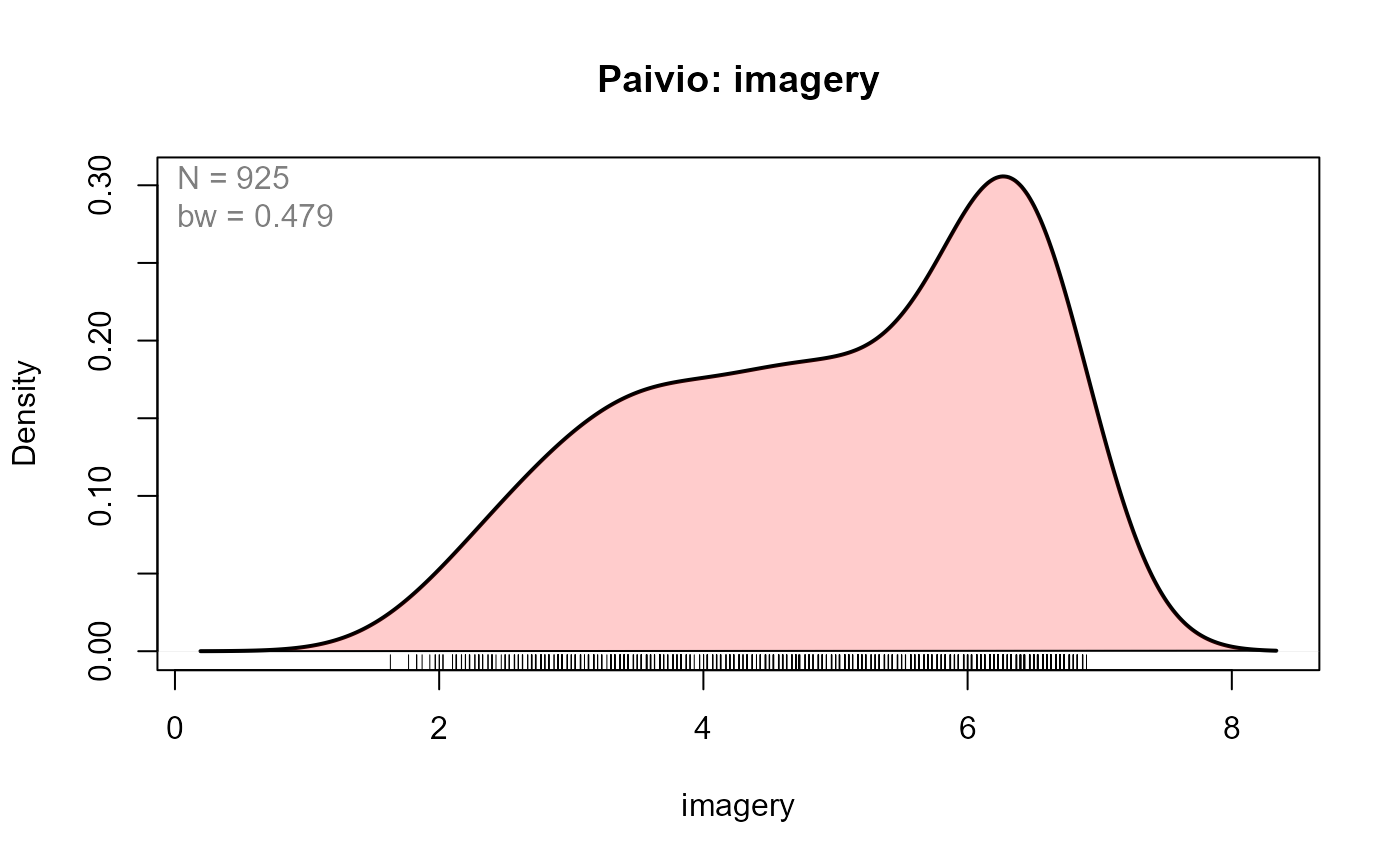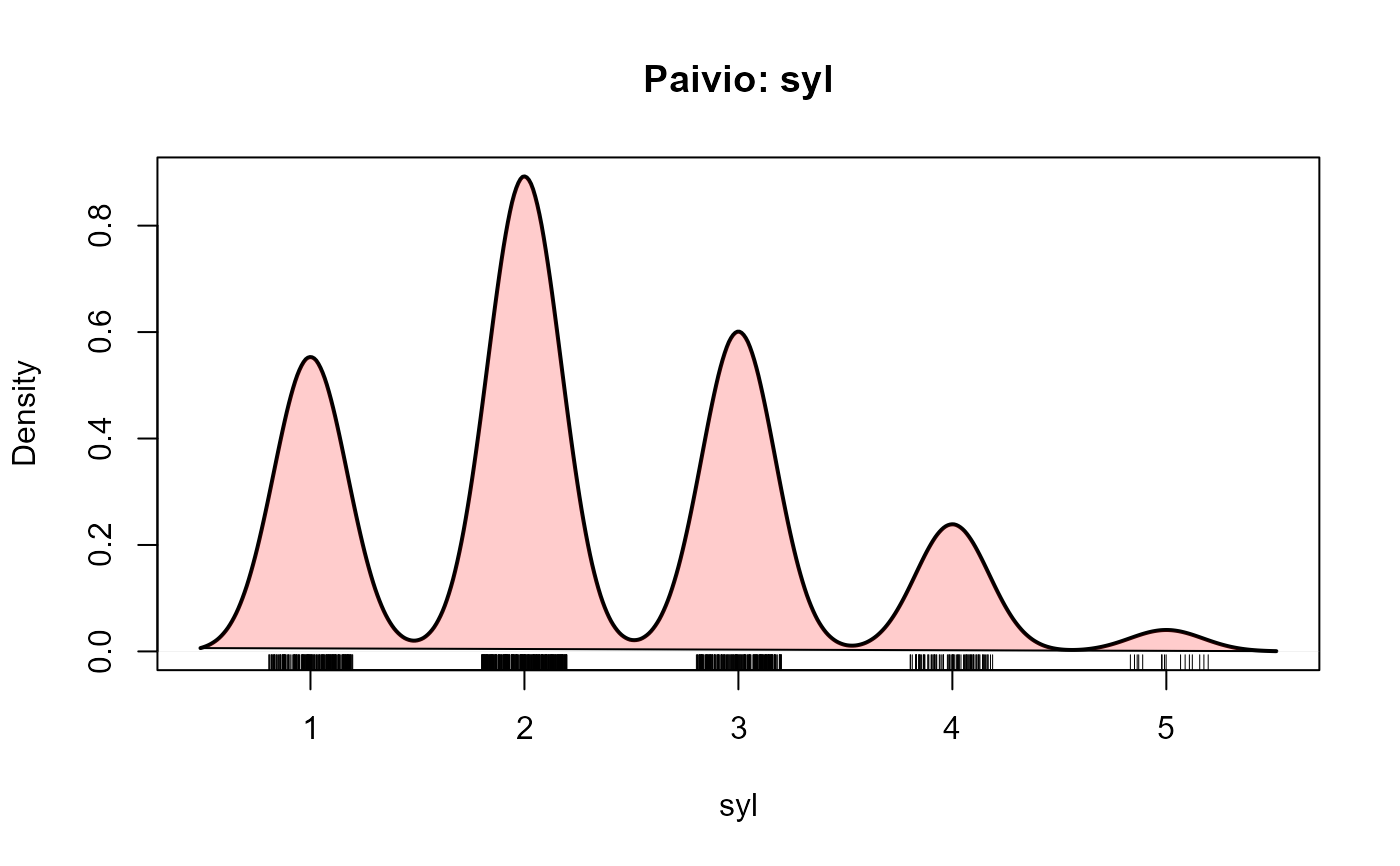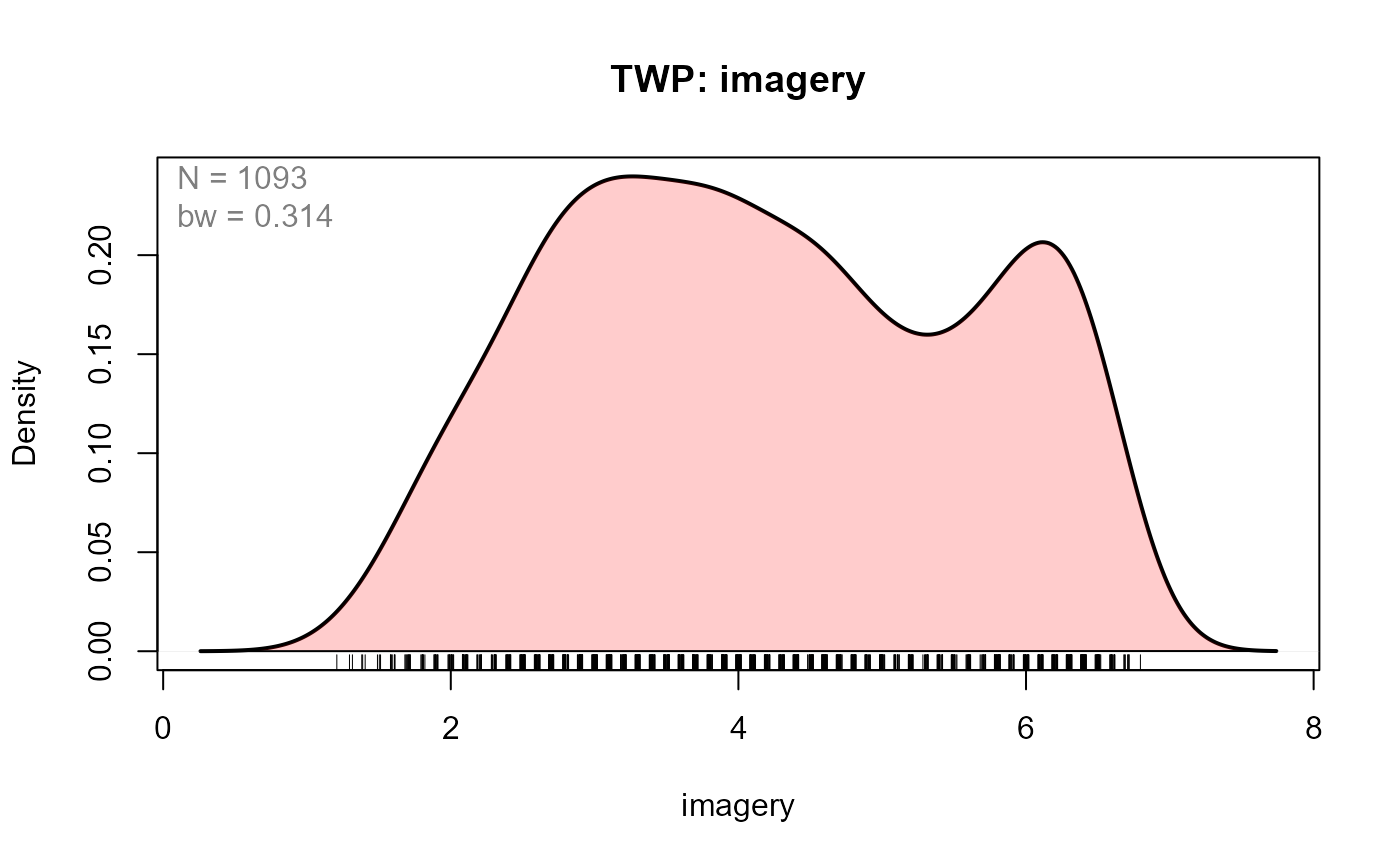
Enhanced density plot for WordPools
plotDensity.RdPlots the distribution of a variable with a density estimate and a rug plot
Usage
plotDensity(
  data,
  var,
  adjust = 1,
  lwd = 2,
  fill = rgb(1, 0, 0, 0.2),
  xlab = NULL,
  main = NULL,
  anno = FALSE,
  ...
)
Arguments
- data
A data.frame
- var
Name of the variable to be plotted
- adjust
Adjustment factor for the bandwidth of the density estimate
- lwd
line width
- fill
Color to fill the area under the density estimate
- xlab
Label for the variable
- main
Title for plot
- anno
If
TRUE- ...
Other arguments passed to
plot.density
Value
Returns the result of density


