Before any serious fieldwork, the seasoned researcher prepares. In a physical science laboratory, this might mean calibrating instruments, collecting materials, donning protective equipment. In an experimental psych lab, it means generating your memory lists (using the WordPools package), or designing a computer-controlled experiment with PsychoPy or PsyToolKit.
On the beach, it means something rather more enjoyable for the budding Beach Scientist: it means calibrating yourself!
👣 The Four Steps
Step one: Lie Yourself Right Down.
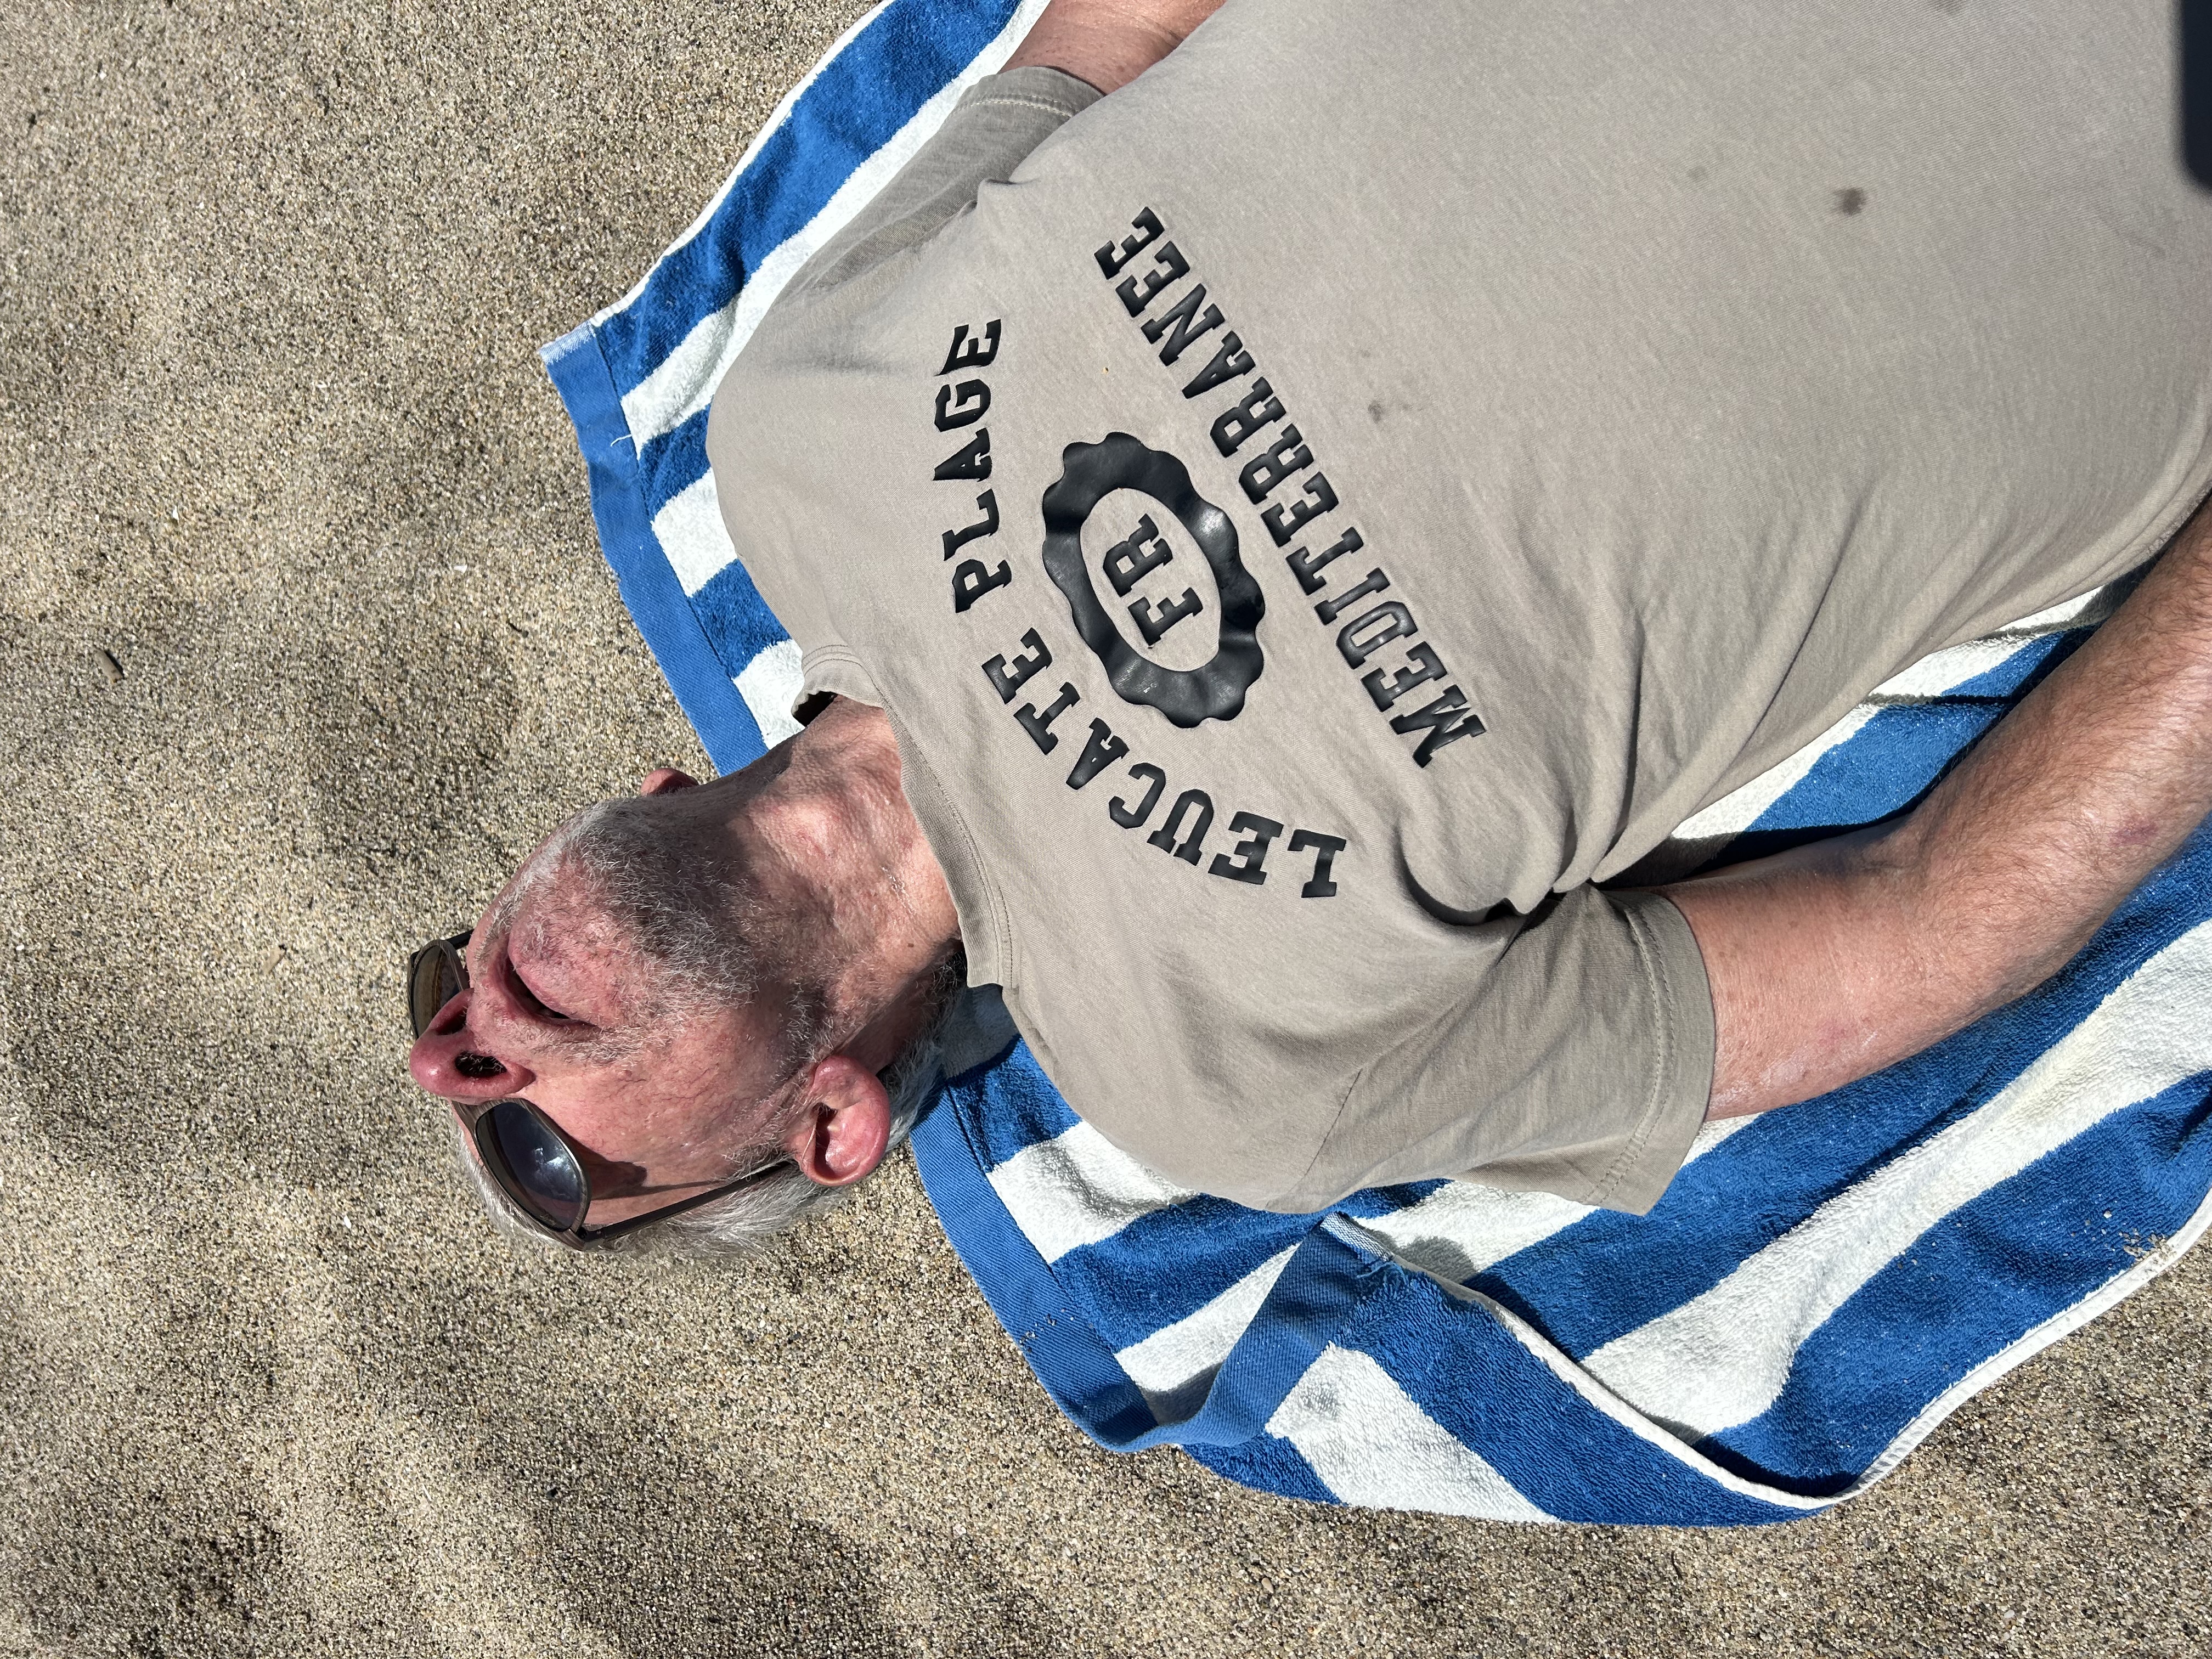 Do not just slump! Certainly do not perch anxiously on the edge of your towel. Become Fully Horizontal. Commit your body and mind to the surface beneath you. Feel the small bumps in the sand redistribute themselves under your weight, but work with the sand, never just against it. Wiggle your bum, move your shoulders until you are most comfortable. This is your proprioception talking directly to you. Note it, but let this fade into the background.
Step two: Breathe … Slowly
Close your eyes. Count your breaths slowly—not to calm yourself, but to establish a baseline. One. Two. Notice that each inhale is slightly cooler than each exhale. This is thermodynamics. The air entering your lungs is ambient; the air leaving has been warmed by approximately 37°C of biological machinery. You are a heat engine. Three. Four. Five.
Step three: Feel the breeze.
There is almost always a slight onshore breeze at a beach—warm land, cooler sea, air moving to equalize the pressure difference. Let it find the fine hairs on your forearm. Notice that the breeze makes you cooler not by being cold, but by accelerating the evaporation of moisture from your skin. This is convective heat loss. It is also, incidentally, why wind chill exists.
Step four: Open Your Eyes Briefly— Then Close Them.
Register the light level. Bright white through closed lids means direct sun. Orange-pink means thin cloud. Grey means the clouds have won for now. This is your irradiance reading. No instruments required.
If you’ve done this right: You are now calibrated, and ready to go on grand inner explorations. But a few further exercises may help prime some hidden portion of your cognition for Amazing Beach Science.
🏛️ Intermediate Exercise: Invoke the Ancestors
Your field has heroes. They did not necessarily have better brains than you—they had better questions, or the stubbornness to pursue them, or the good fortune to be lying on the right beach at the right moment. Eyes still closed, summon a few. Here are a few of mine.
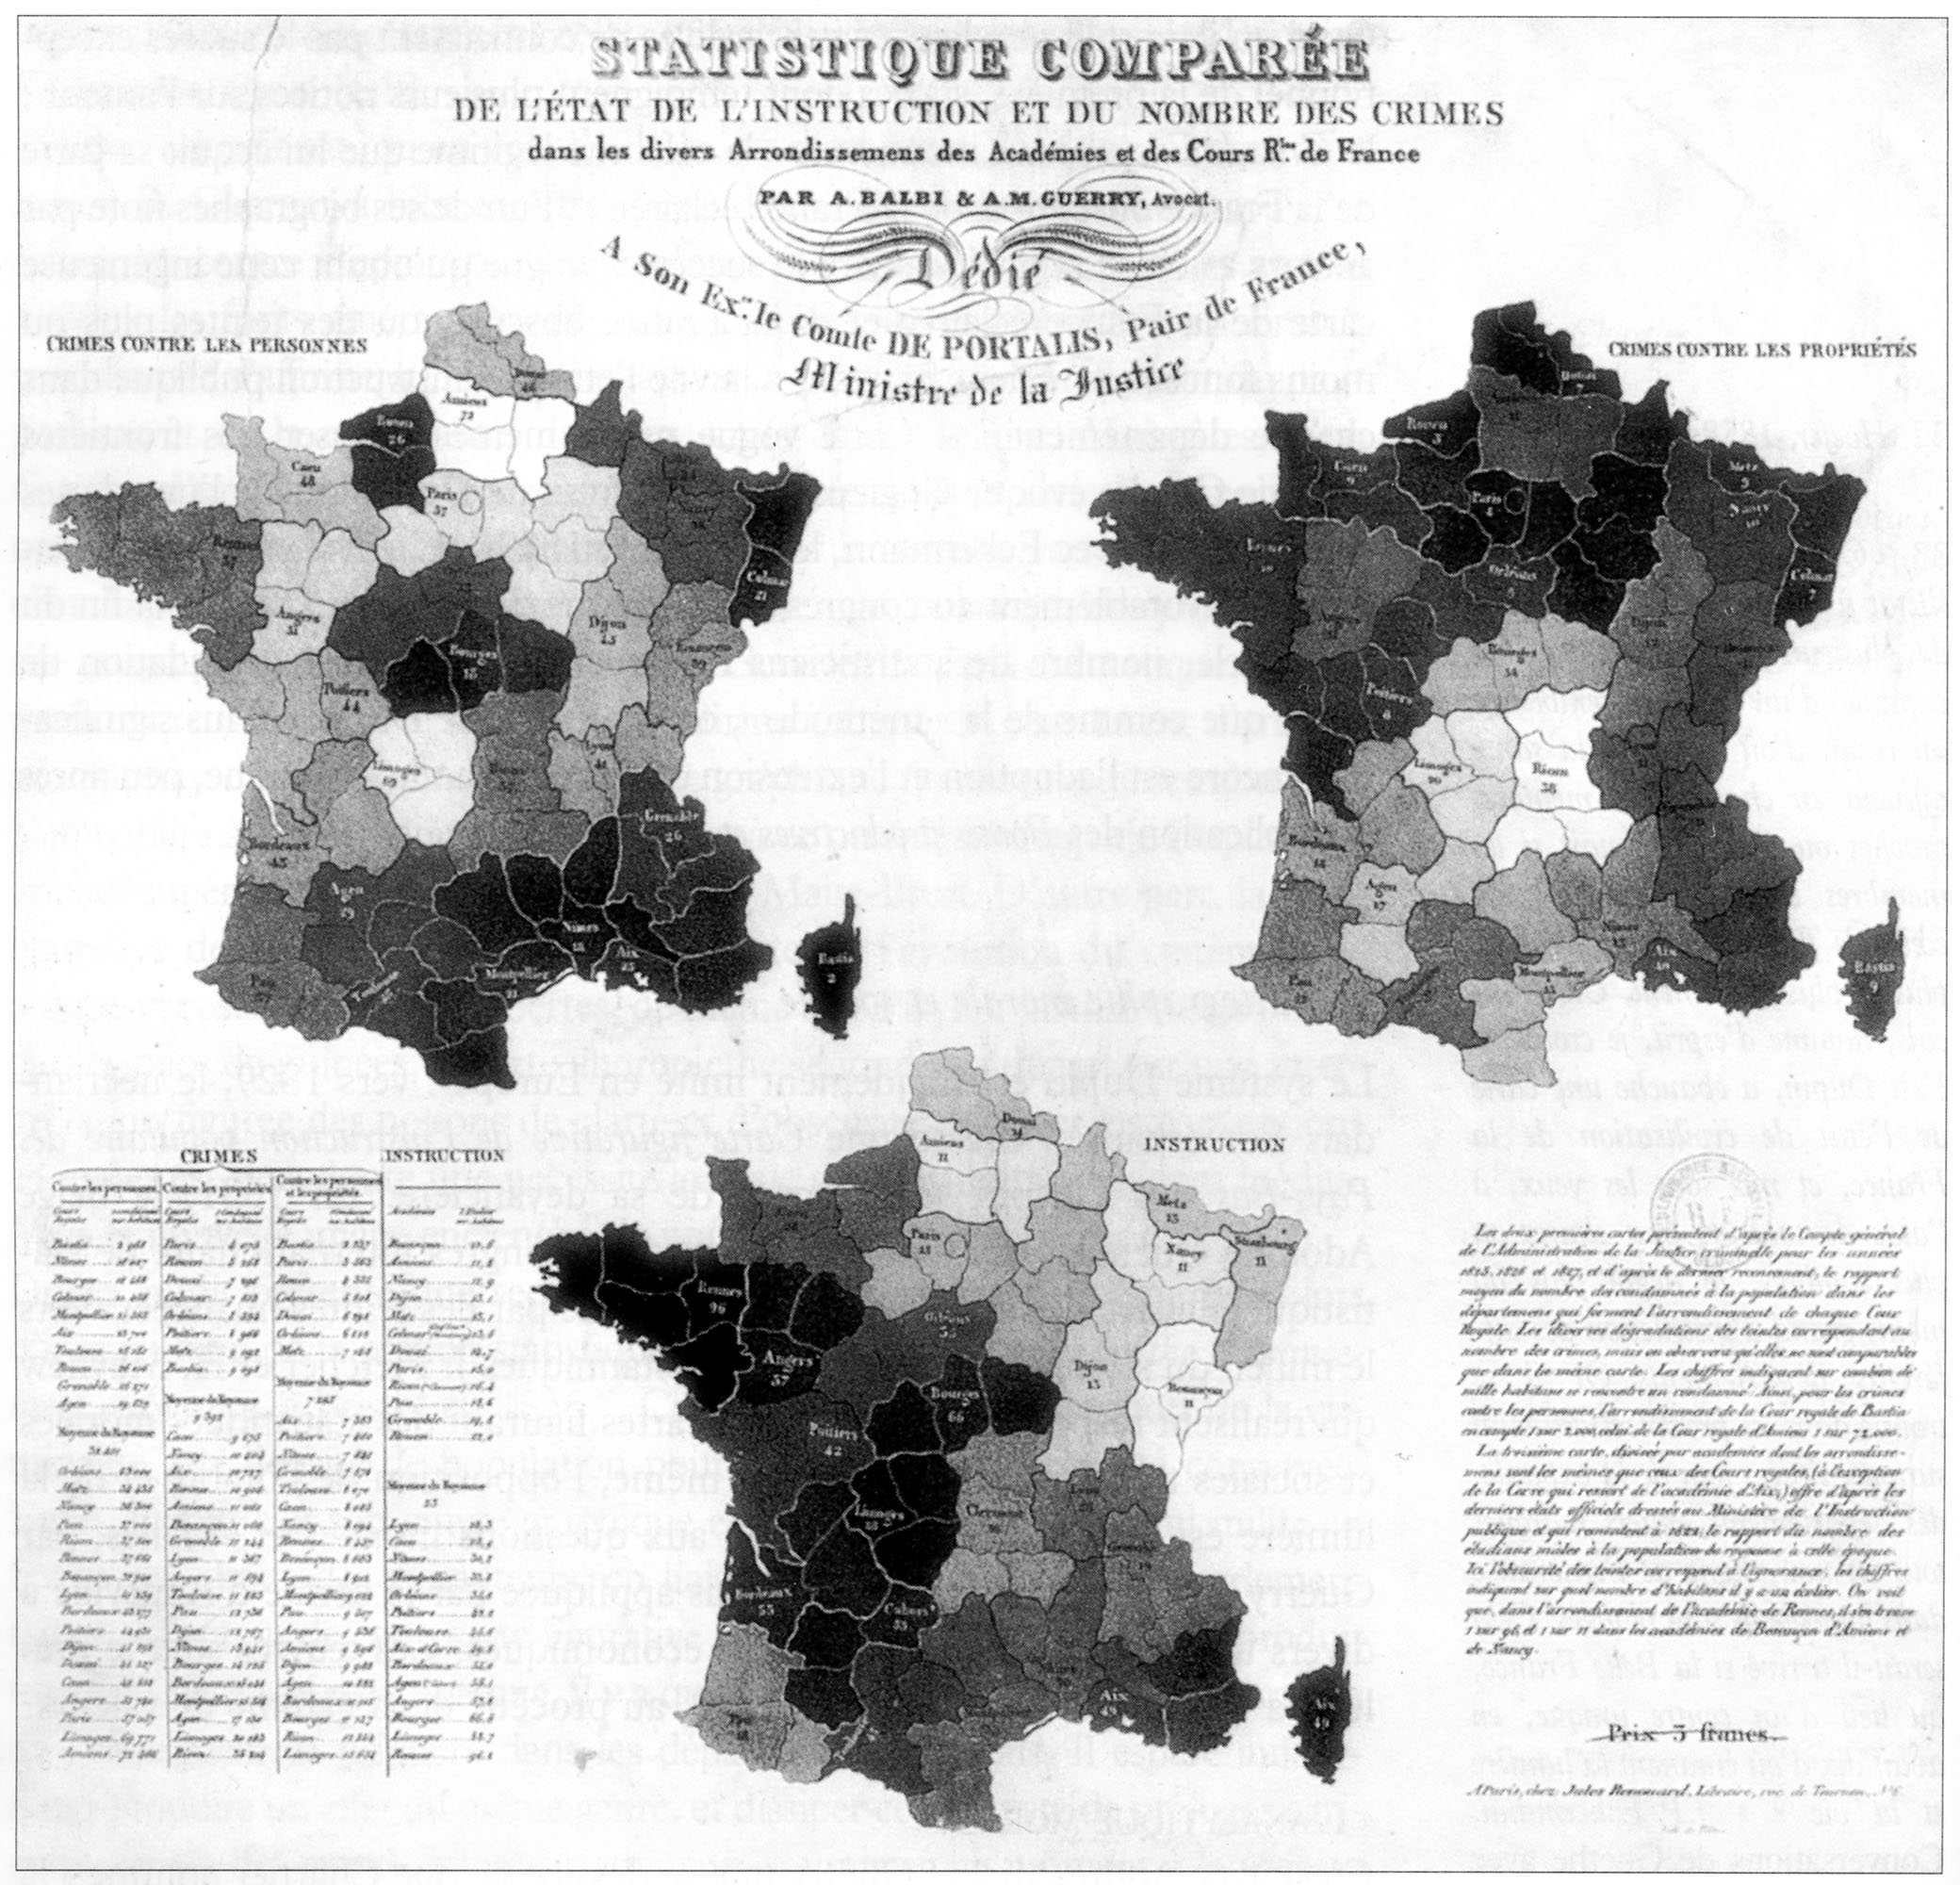 André-Michel Guerry had no computer, no modern notion of social science. What he had, in 1833, was extensive data on crime, a map of France and the conviction that crime, suicide, and ignorance were not random— they had geography, and could be shown to obey certain constancies. He placed data on maps and found patterns nobody had looked for because nobody had thought to look that way. He then discovered, to general consternation, that property crime and crime against persons had totally different patterns and neither was strongly related to education. The data did not confirm what arm-chair moral philosophers already believed. That, it turns out, is just the point. He launched modern social science with his data and maps.
John Snow did not have a microscope or a germ theory. He had a map, a pump handle, and the conviction that data could locate the source of a cholera outbreak before anyone understood what cholera really was. He drew dots. He counted. He was right. The map is still beautiful.
Francis Galton—a complicated man, towering scientist—sat on beaches not unlike this one and wondered about everything: the heritability of genius, the statistics of sweet peas, whether prayer works (he tested it). He invented regression, correlation, and the weather map. He could not stop asking questions. The beach would have suited him perfectly.
William Playfair had no data visualization tradition to follow because he was inventing it. The bar chart, the line graph, the pie chart—all his, conjured from scratch in the late 1700s because he thought trade statistics would be more persuasive as pictures. He was right about that too.
Jacques Bertin sat in Paris and asked a question nobody had quite posed before: what are the fundamental visual properties that carry information in a graphic? His answer—position, size, shape, value, colour, orientation, texture, the seven “retinal variables”—gave data visualization its first grammar. His 1967 Semiologie Graphique is still among the most important books in the field, and most people working in data viz today are building, knowingly or not, on his foundations.
Florence Nightingale took the same instinct into a Crimean field hospital and produced the rose diagram—a polar area chart showing that soldiers were dying not from wounds but from preventable infection. She sent it to Parliament and lobbied for medical reform. Things changed. Lives were saved.
Edward Tufte spent decades arguing, with great patience, that chartjunk is a moral failing and that data should be allowed to speak without decoration shouting over it. He was not always right, but he was always interesting. His books awakened interest in data visualization done with principles.
Daniel Kahneman lay (metaphorically) on the beach of human judgment and noticed that the mind is not a rational calculator—it is a storytelling machine that occasionally does arithmetic. He and Amos Tversky mapped its biases so carefully that you now cannot read a menu, fill out a form, or watch the news without seeing their fingerprints.
The point of this exercise is not nostalgia. It is perspective. Each of these people started with a question that seemed almost too simple—where is the disease coming from? can numbers be pictures? why do people make predictable mistakes?—and followed it somewhere remarkable.
Your questions are lying here with you on the sand. Give them time.
🧠 Advanced Exercise: Invoke Your Inner Claude
The ancestors are good company, but they are unavailable for follow-up questions. For that, you need something newer.
Close your eyes and imagine a collaborator who has read, more or less, everything—every paper, every textbook, every half-forgotten methodology appendix—and is lying here beside you on the sand, unhurried, with no agenda and no office hours. This is your inner Claude.
Now ask it something. Not a search query. A real question, the kind you’d ask a brilliant colleague: What do we actually know about how people perceive warmth? What would a proper study design look like? What am I missing?
The discipline here is precision. Vague questions get vague answers, from AIs and from your own mind alike. The act of formulating a question clearly enough to ask—specific, curious, honest about what you don’t know—is itself half the scientific work. Your inner Claude is waiting. It is, by nature, patient.
You are now even more calibrated.
🌊 Extra credit: Learn to Float
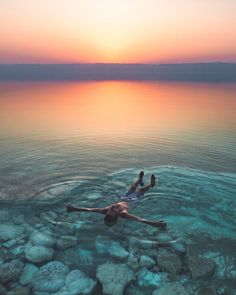 This one requires water—calm water, ideally the kind that barely moves, the Mediterranean on a generous morning. Wade in to waist depth, then lay yourself down on the surface and let go. Arms slightly out, face to the sky. Resist nothing.
Floating is harder than it sounds for some people and effortless for others, depending on body composition and, more importantly, willingness to trust the water. The physics is straightforward—you are less dense than seawater—but the nervous system takes some convincing.
Once you are floating, count your breaths. Slowly. In French, if you can: un, deux, trois… French slows you down in ways English does not. By the time you reach cinquante—fifty—the cold will have become normal, the sky will have become interesting, and at least one scientific question will have floated to the surface alongside you.
🌊 Floating style
There’s another hidden BS question about floating: not just can you float, but how should you position your body to float most stably? Do you go Jesus-style—arms outstretched in a T, legs together—or Vitruvian Man-style, limbs spread at angles? Da Vinci actually showed both positions, in a simple image with profound geometry.
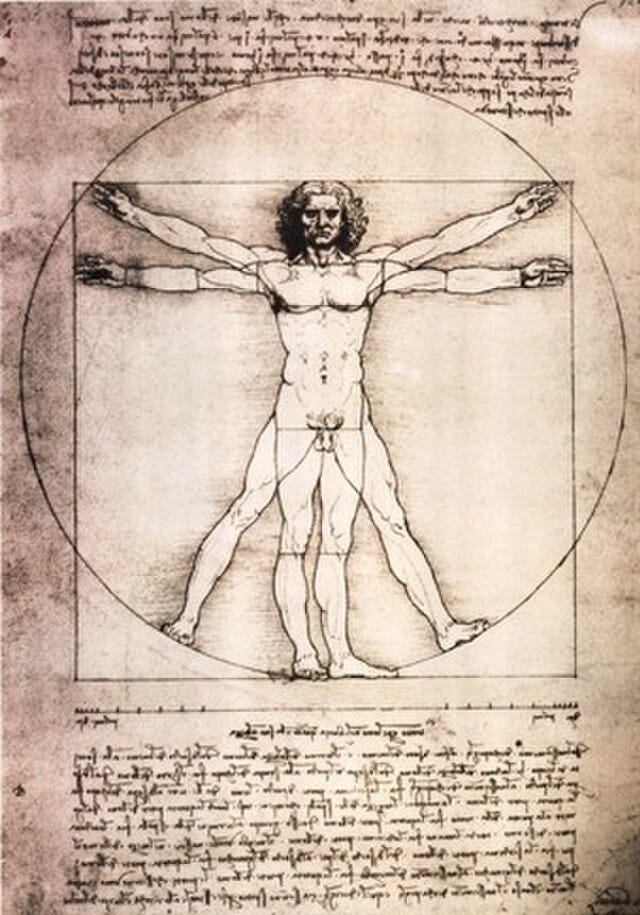 The answer is almost certainly Vitruvian Man, and the reasoning is genuinely fun to unpack.
The core physics: Floating stability requires your center of buoyancy (CB) to stay vertically aligned with your center of gravity (CG). The problem is that your legs are denser than your torso (bone, muscle, less air), so they want to sink—rotating you face-down.
Why Vitruvian beats Jesus:
Legs spread (the key difference): Spreading your legs laterally distributes the dense lower-body mass over a wider footprint of water surface. Each leg gets more independent buoyant support. Jesus keeps legs together, concentrating that sinking tendency.
Arms at ~45° vs. 90°: The Jesus T-pose puts arms at maximum lever arm from the body’s axis, which helps resist rolling—like outriggers. But arms at 45° (Vitruvian) are closer to the chest/lung buoyancy center, keeping the whole configuration more neutrally balanced front-to-back.
Rotational stability: The spread-limb Vitruvian position maximizes the second moment of area of the body’s cross-section—more resistance to tipping in any direction. It’s essentially increasing your rotational inertia.
The survival float connection: Swim instruction teaches the “starfish float”—which is Vitruvian Man. This isn’t coincidence; it’s empirically converged on the stable solution.
The fun wrinkle: Body composition matters enormously. A high-fat floater can get away with Jesus (or nearly anything). A lean, muscular swimmer may need more than Vitruvian—arching the back to push the chest up, tilting the head back to shift CG posteriorly. So the optimal pose is a function of your personal density distribution—a lovely individual differences angle.
Da Vinci wins over the Gospels, at least hydrodynamically.
Assistive devices: Pool hammock
 If you find floating a challenge, even in very gentle water, there’s a category of flotation aid that solves this specific problem: staying water-borne and roughly horizontal in waves without fighting them. The design that works best, called a pool hammock, is two inflatable cylinders connected by a mesh panel — you lie across the mesh, the cylinders take the buoyancy load on either side, and the structure flexes with the swell instead of resisting it. The mesh is the clever part: it doesn’t trap water (no dead weight, no drag), and it lets the device articulate slightly as a wave passes under one cylinder before the other, rather than pitching you like a rigid board would.
It’s a nice small case study in matching device geometry to wave dynamics — rigid flotation devices (boogie boards, foam noodles) fight the wave’s local slope, while a hinged, flexible structure like this one rides it, keeping you comfortably water-borne rather than constantly re-fighting your balance.
You are completely ready.
The questions of Beach Science may begin.