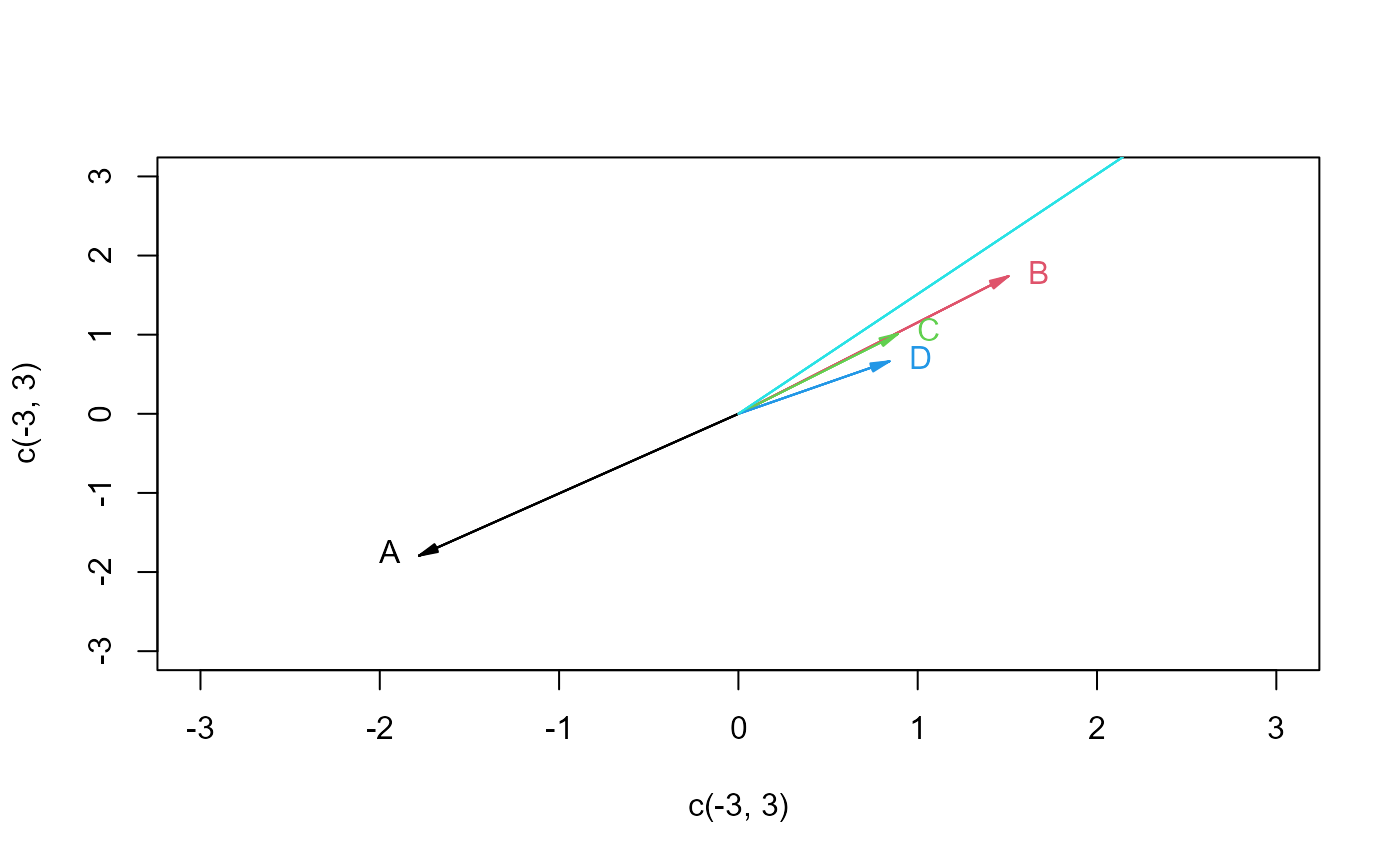
Graphics utility functions to draw vectors from an origin to a collection of
points (using graphics::arrows() in 2D or
rgl::lines3d() in 3D) with labels for each (using graphics::text()
or rgl::texts3d()
Arguments
- x
A two-column matrix or a three-column matrix containing the end points of the vectors
- origin
Starting point(s) for the vectors
- labels
Labels for the vectors
- scale
A multiplier for the length of each vector
- col
color(s) for the vectors.
- lwd
line width(s) for the vectors.
- cex
color(s) for the vectors.
- length
For
vectors, length of the edges of the arrow head (in inches).- angle
For
vectors, angle from the shaft of the arrow to the edge of the arrow head.- pos
For
vectors, position of the text label relative to the vector head. Ifpos==NULL(the default), labels are positioned labels outside, relative to arrow ends- ...
other graphical parameters, such as
lty,xpd, ...
Details
The graphical parameters col, lty and lwd can be
vectors of length > 1 and will be recycled if necessary across the rows of x which define the vectors.
For use in high-level plots, vecscale() can be used to find a value for the scale argument to automatically re-scale
the vectors to approximately fill the plot region.
The option xpd = TRUE can be passed to vectors() via the ... argument to avoid labels being clipped.