Color and fill scales using Cheysson palettes from the Albums de Statistique Graphique.
Usage
scale_color_cheysson(
  palette = "1880_07",
  discrete = TRUE,
  reverse = FALSE,
  ...
)

scale_colour_cheysson(
  palette = "1880_07",
  discrete = TRUE,
  reverse = FALSE,
  ...
)

scale_fill_cheysson(palette = "1880_07", discrete = TRUE, reverse = FALSE, ...)
Arguments
- palette
Name of palette (e.g., "1880_07") or palette type ("sequential", "diverging", "grouped", "category"). Default is "1880_07".
- discrete
Whether to use a discrete (TRUE) or continuous (FALSE) scale. Default is TRUE.
- reverse
Whether to reverse the palette colors. Default is FALSE.
- ...
Additional arguments passed to ggplot2 scale functions
Value
A ggplot2 scale object that can be added to a plot. For discrete scales, returns a discrete_scale object. For continuous scales, returns a continuous scale object (gradient).
Examples
# \donttest{
library(ggplot2)
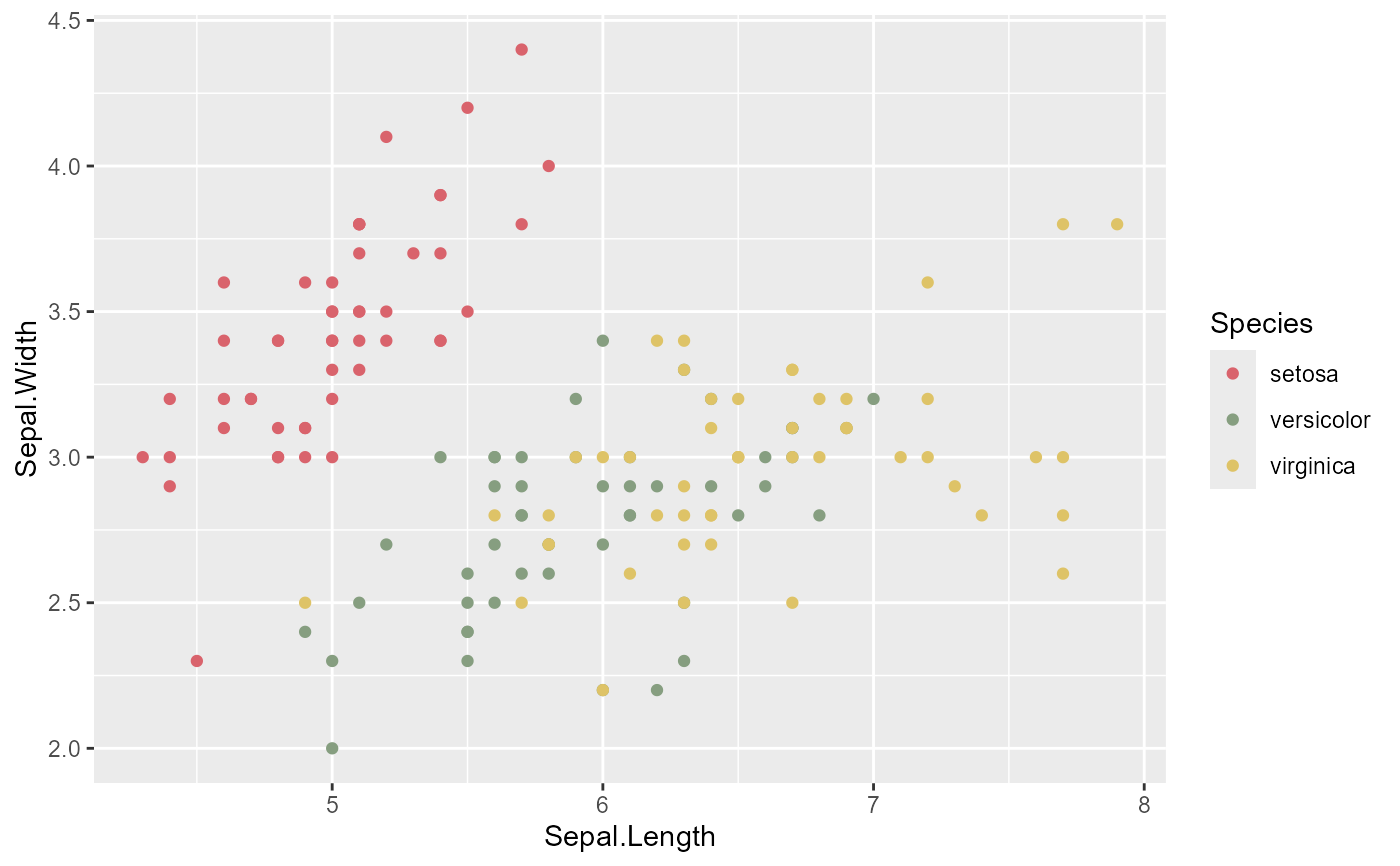
# Discrete color scale
ggplot(iris, aes(Sepal.Length, Sepal.Width, color = Species)) +
geom_point() +
scale_color_cheysson()
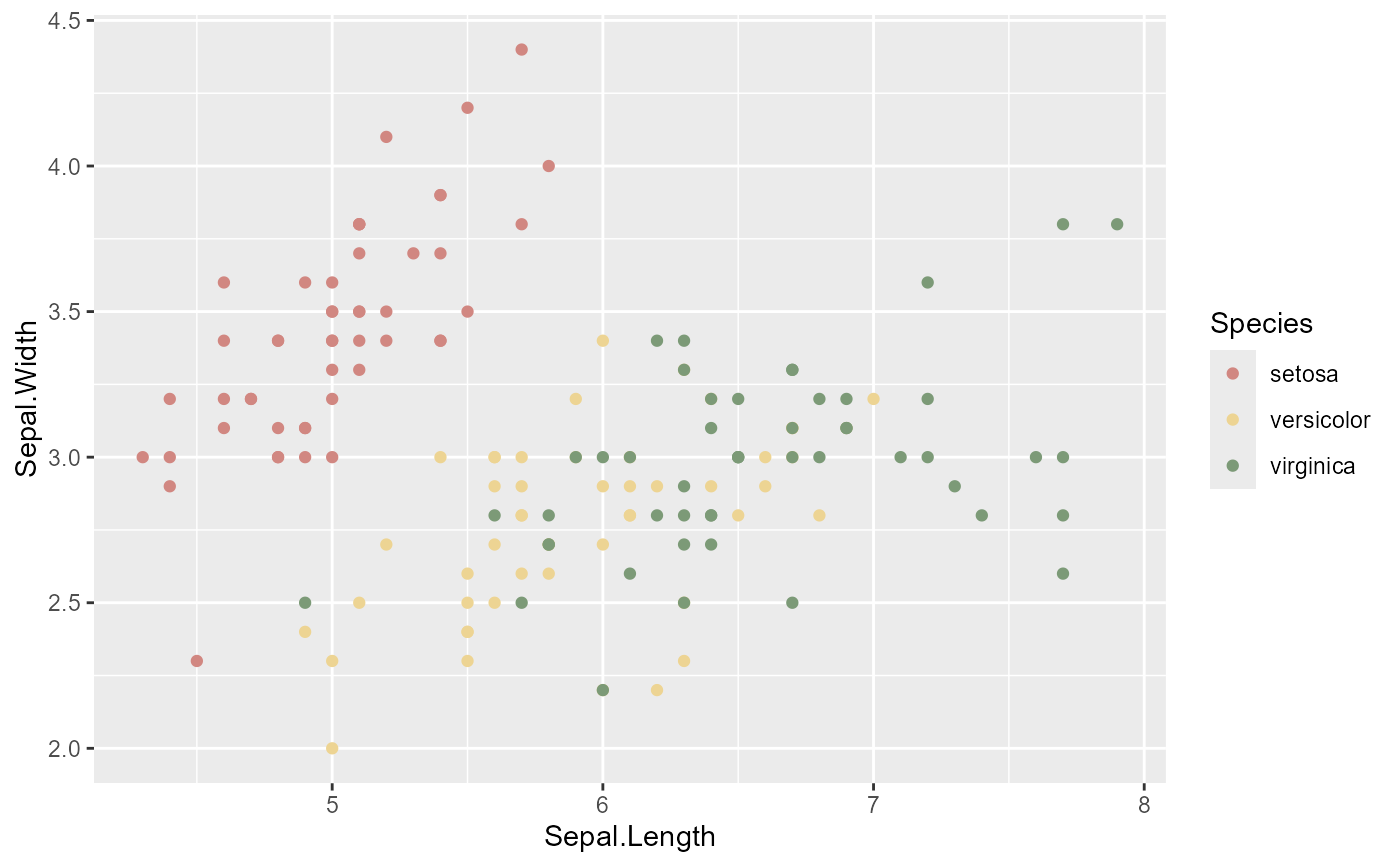
 # Use a specific palette
ggplot(iris, aes(Sepal.Length, Sepal.Width, color = Species)) +
geom_point() +
scale_color_cheysson(palette = "1881_04")
# Use a specific palette
ggplot(iris, aes(Sepal.Length, Sepal.Width, color = Species)) +
geom_point() +
scale_color_cheysson(palette = "1881_04")
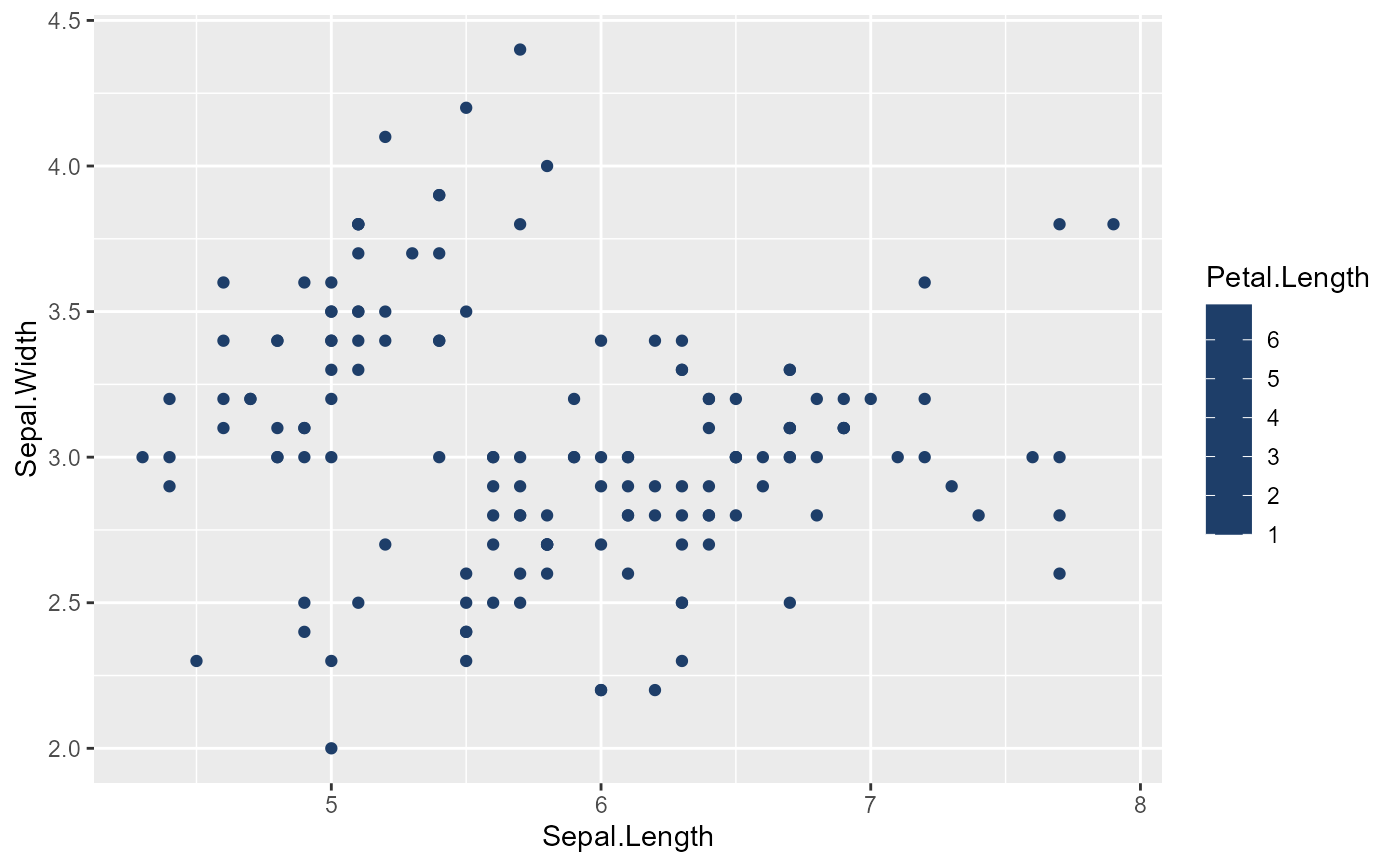
 # Use a sequential palette for continuous data
ggplot(iris, aes(Sepal.Length, Sepal.Width, color = Petal.Length)) +
geom_point() +
scale_color_cheysson(palette = "sequential", discrete = FALSE)
# Use a sequential palette for continuous data
ggplot(iris, aes(Sepal.Length, Sepal.Width, color = Petal.Length)) +
geom_point() +
scale_color_cheysson(palette = "sequential", discrete = FALSE)
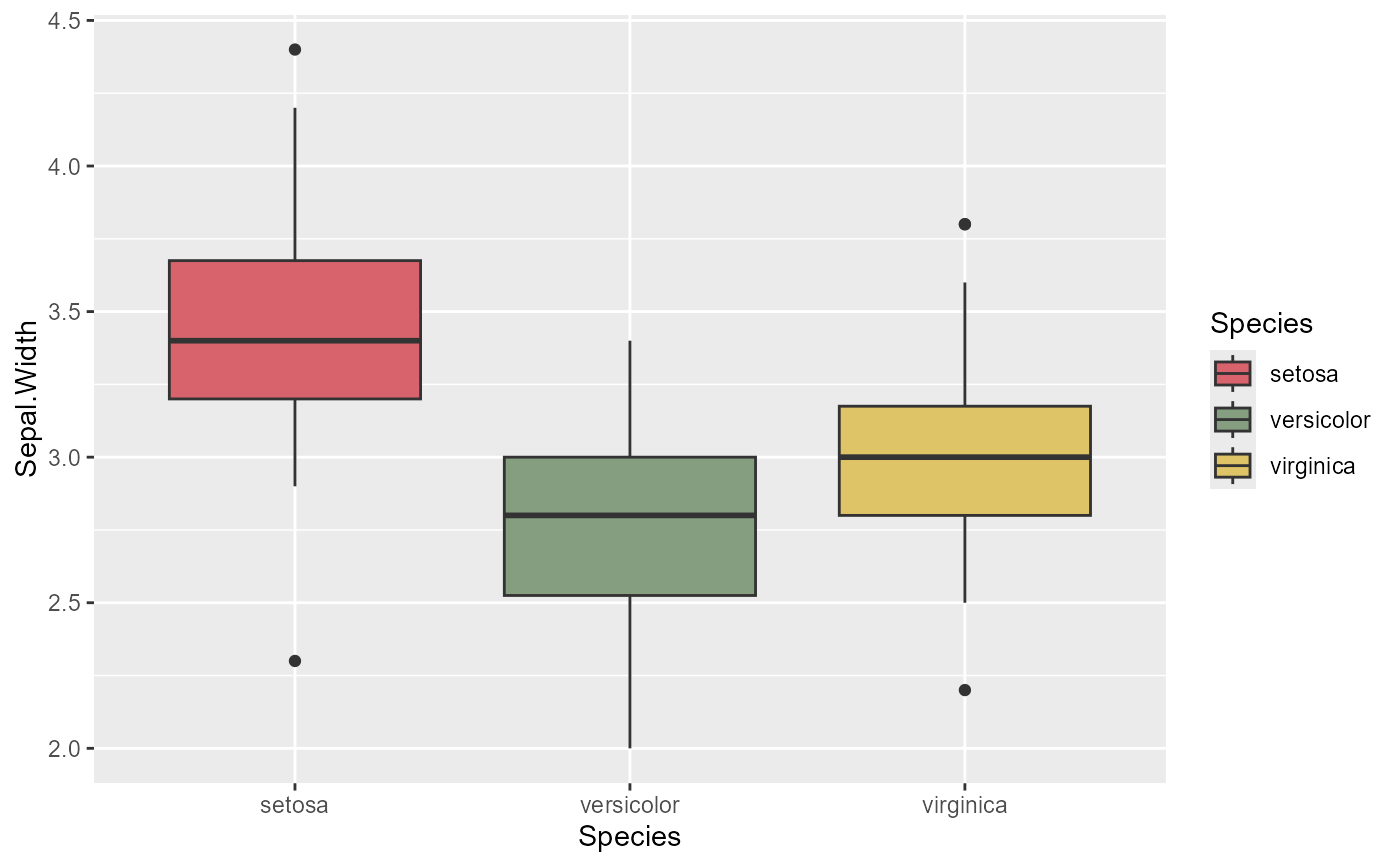
 # Fill scale with category colors
ggplot(iris, aes(Species, Sepal.Width, fill = Species)) +
geom_boxplot() +
scale_fill_cheysson(palette = "category")
# Fill scale with category colors
ggplot(iris, aes(Species, Sepal.Width, fill = Species)) +
geom_boxplot() +
scale_fill_cheysson(palette = "category")
 # }
# }