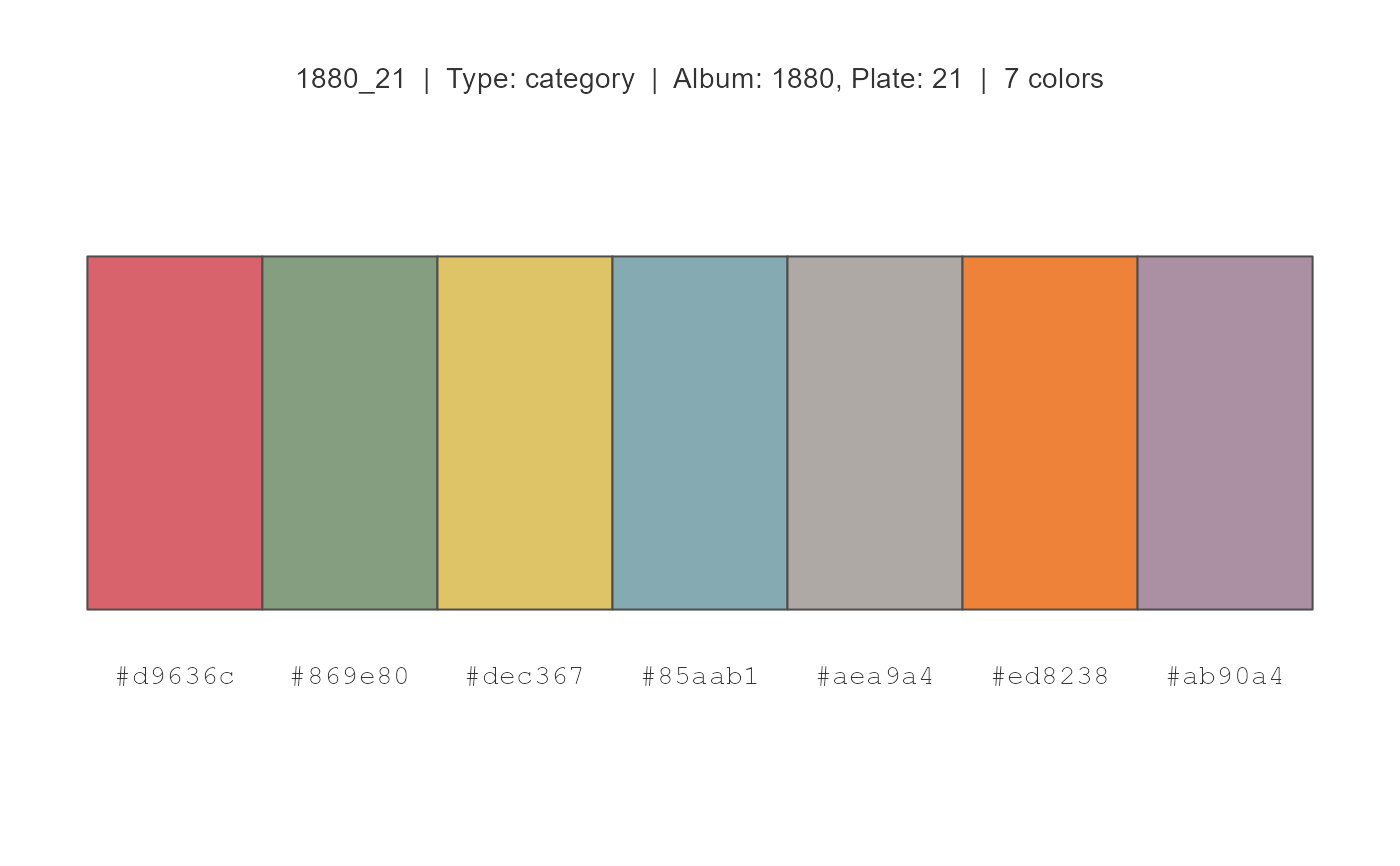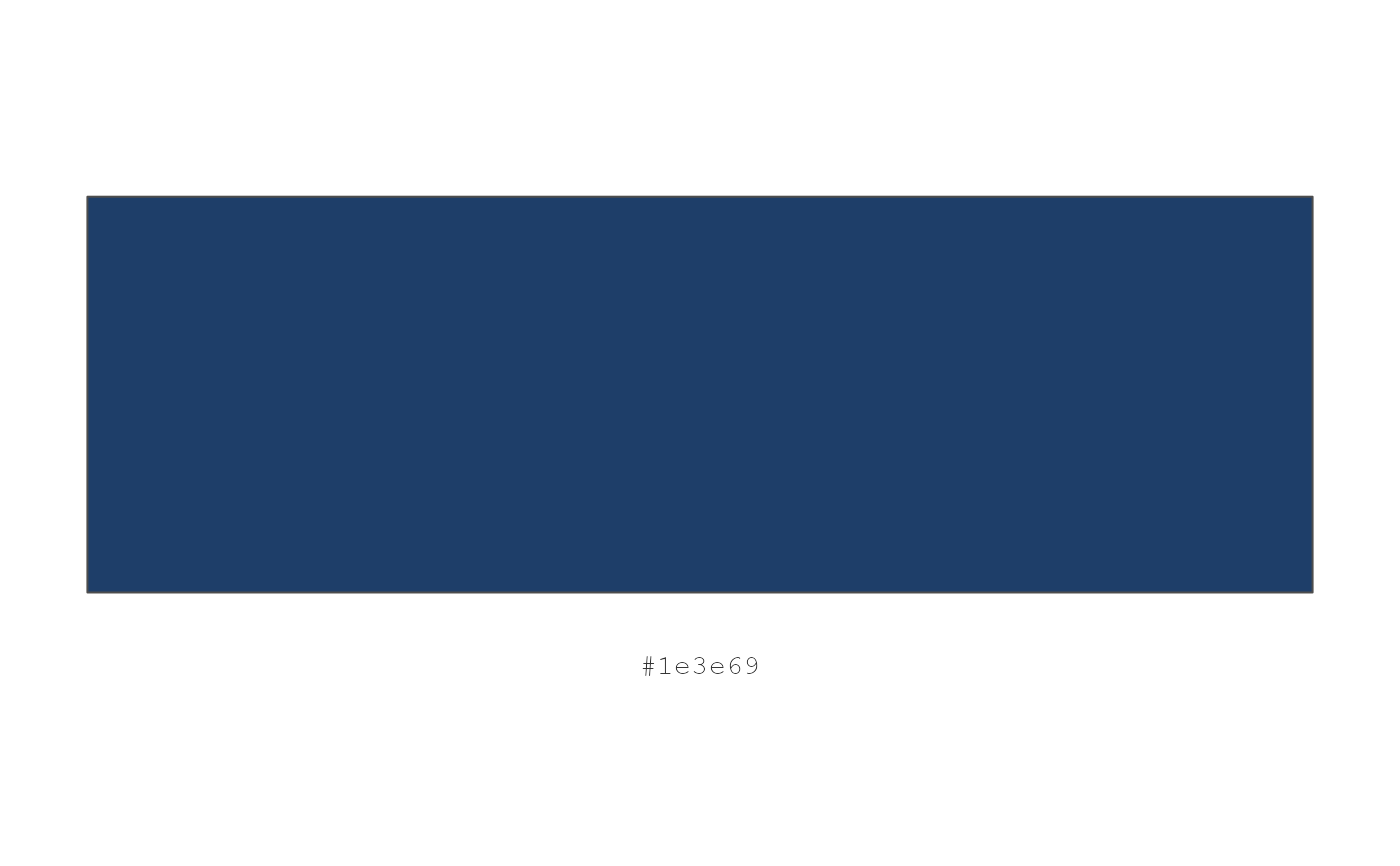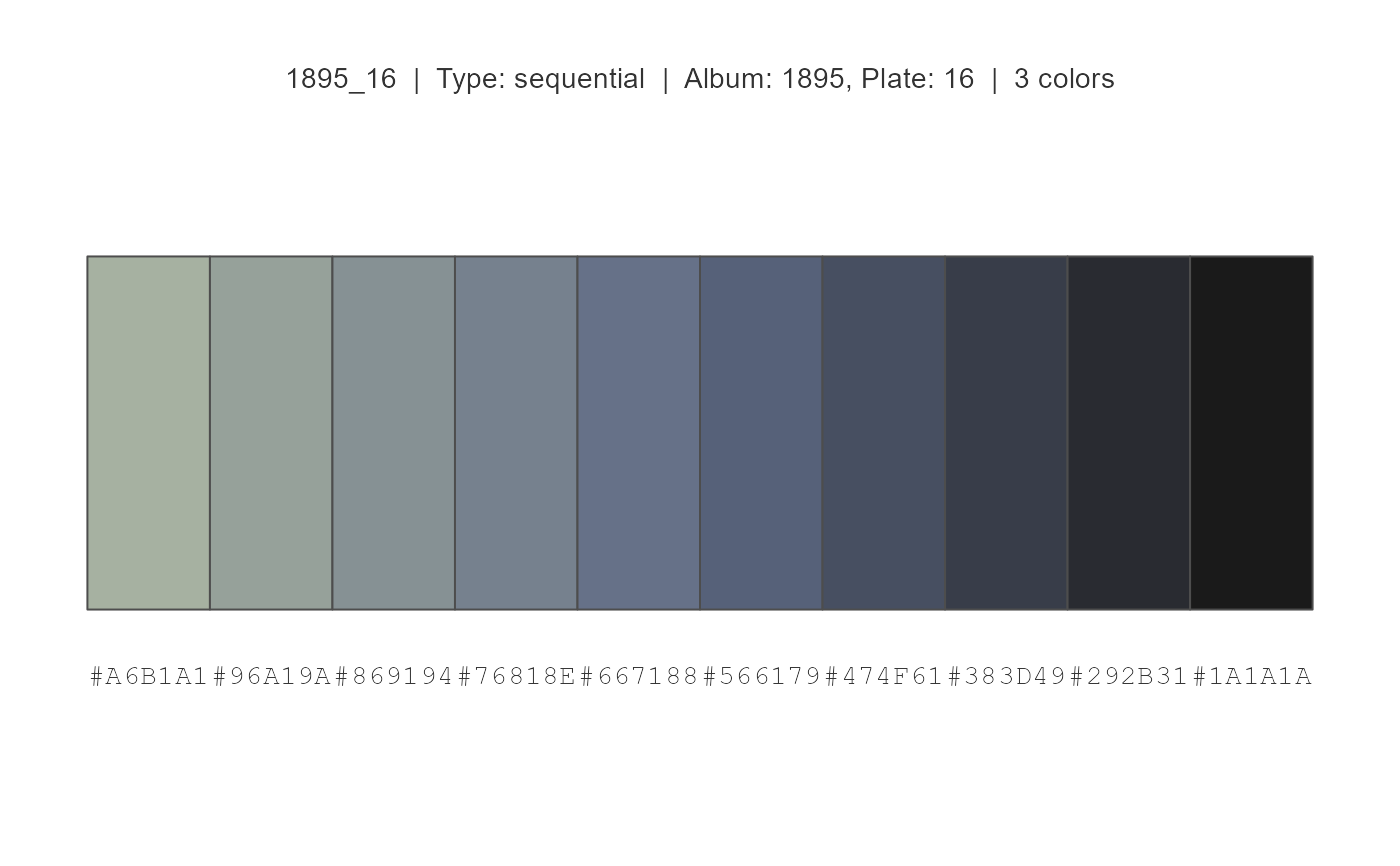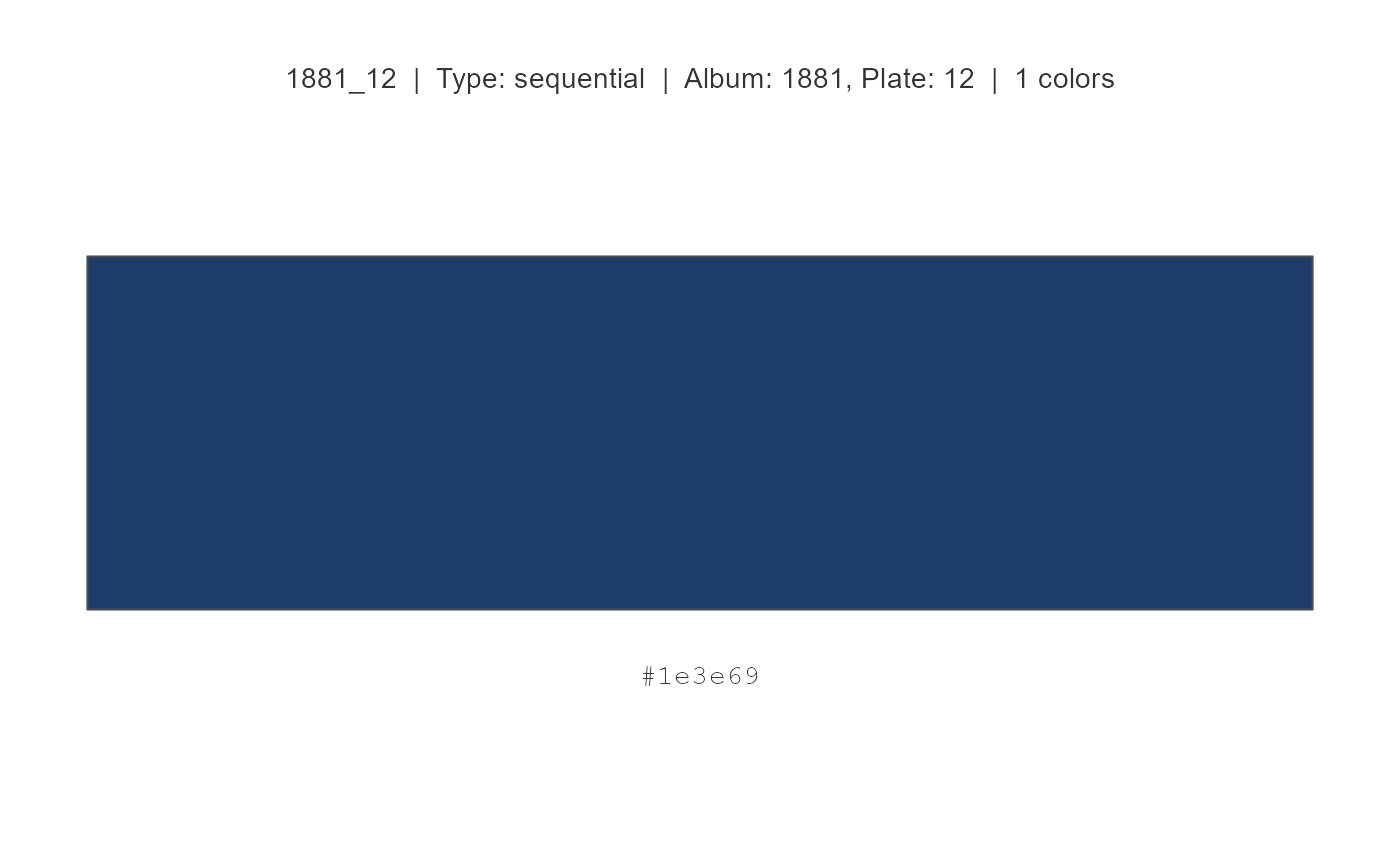
Creates a visual display of a color palette showing color swatches along with their hex codes. This is useful for documentation, presentations, and exploring the available palettes.
Arguments
- palette
Name of palette (e.g., "1880_21"), or palette type ("sequential", "diverging", "grouped", "category").
- n
Number of colors to display. If NULL (default), shows all colors in the palette. If specified, will interpolate if n > palette size.
- show_info
Logical; if TRUE (default), displays palette metadata (type, album, plate) above the swatches.
- cex
Text size multiplier for hex codes (default 1).