The goal of the milestoneR package is to provide R access to the database tables used in the Milestones Project, reflecting the history of data visualization, as used in http://datavis.ca/milestones and other applications on this site, such as the Milestones Calendar. This project is described in Friendly et al. (2015).
Another goal is to document what we have done to create a database comprised of important events in this history, combined with source images, external links, references, etc. to make this useful for further research.
No attempt is made here to replicate the interactive features of the Milestones site, which include:
- overview pages for time periods, such as 1700-1799: New graphic forms, or 1850-1899: Golden Age of data graphics
- A Milestones calendar listing birthdays, death days and the days of significant events associated with individuals in the history of data visualization.
- A keyword index
- Related resouces
- A google-powered search, eg Search: “Playfair”
Installation
This package is not yet on CRAN. You can install this development version with:
remotes::install_github("friendly/milestoneR")Database schema
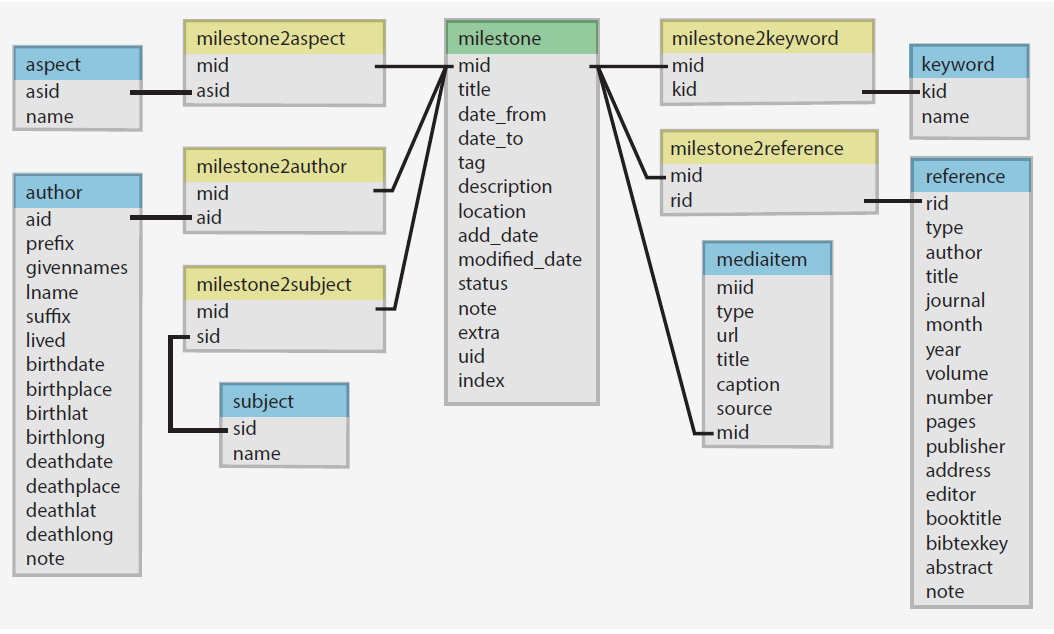
The milestones database was designed as a relational database (implemented in MySQL). It consists of the tables shown in the figure below.
The main table (milestone) contains information regarding each of the items considered a milestone in the history of data visualization. These are linked to other tables (e.g., author, reference, mediaitem) by unique (primary) keys: mid is the key for a given milestones item.
Each milestones item is coarsely classified in two tables:
subjectindicates the substantive context of the milestones event, with categories “Physical”, “Mathematical”, “Human”, “Other”.aspectindicates the role this event played in the history of data visualization, with categories “Cartography”, “Statistics & Graphics”, “Technology”, “Other”.
In addition, there is a freeform keyword table listing keywords or terms attached to milestones items.
Other supporting tables (e.g., milestones2subject, milestone2aspect) provide for convenient lookups of descriptors of these milestones items (subject, aspect, keyword) using the milestones id (mid) as the key.
Package Functions
The milestoneR package provides three main categories of functions:
Data accessor functions
These functions retrieve the main tables from the package:
-
milestone()- Get the main milestone table (297 milestones) -
authors()- Get the author table (268 authors) -
reference()- Get the reference table (352 references) -
mediaitem()- Get the media items table -
keyword()- Get the keyword lookup table (335 keywords) -
subject()- Get the subject lookup table (4 subjects) -
aspect()- Get the aspect lookup table (4 aspects)
Linking tables that connect milestones to other entities:
-
milestone2author()- Links milestones to authors -
milestone2reference()- Links milestones to references -
milestone2keyword()- Links milestones to keywords (includes keyword names) -
milestone2subject()- Links milestones to subjects (includes subject names) -
milestone2aspect()- Links milestones to aspects (includes aspect names)
Helper functions for milestones
These functions retrieve related information for one or more milestones:
-
get_milestone_authors(mid)- Get authors associated with milestone(s) -
get_milestone_references(mid)- Get references for milestone(s) -
get_milestone_keywords(mid)- Get keywords for milestone(s) -
get_milestone_subjects(mid)- Get subjects for milestone(s) -
get_milestone_aspects(mid)- Get aspects for milestone(s) -
get_milestone_media(mid)- Get media items for milestone(s)
These functions accept single or multiple milestone IDs and return joined data frames.
Print functions
Functions for formatted display of database entries:
-
print_milestone(mid, result = c("text", "html", "md"))- Print complete milestone information- Includes authors, description, keywords, subjects, aspects, references
- Multiple output formats: text, HTML, or markdown
- Optional
includeparameter to select which sections to display
-
print_reference(rid, result = c("text", "html", "md", "bibtex"))- Print formatted references- Standard citation formats plus BibTeX output
- Accepts single or multiple reference IDs
-
print_author(aid, result = c("text", "html", "md"))- Print author information- Includes birth/death dates and locations
- Multiple output formats
Search functions
Functions for searching and filtering milestones:
-
search_milestones(pattern, fields, output, ignore.case, ...)- Full-text search across milestone fields- Regular expression support for flexible pattern matching
- Search in description, tag, note, location, and other fields
- Three output formats: “mid” (IDs), “print” (formatted), “data” (data frame)
-
search_keywords(pattern, ignore.case, output, ...)- Search by milestone keywords- Find milestones tagged with specific keywords
- Same output options as search_milestones()
-
search_authors(pattern, name_fields, ignore.case, output, ...)- Search by author name- Find milestones associated with specific authors
- Search across given names, last names, or both
Example
library(milestoneR)

# Get all milestones
ms <- milestone()
cat("Total milestones:", nrow(ms), "\n")
#> Total milestones: 297

# Look at Halley's 1701 contour map milestone
halley <- ms |>
  subset(date_from_numeric == 1701)
cat("\nMilestone:", halley$tag, "\n")
#>
#> Milestone: 1st contour map?
cat("Date:", halley$date_from, "\n")
#> Date: 1701

# Get related information using helper functions
authors <- get_milestone_authors(halley$mid)
cat("\nAuthor:", authors$givennames, authors$lname, "\n")
#>
#> Author: Edmond Halley

keywords <- get_milestone_keywords(halley$mid)
cat("Keywords:", paste(keywords$keyword, collapse = ", "), "\n")
#> Keywords: contour map, isogonic

# Print the complete milestone in text format
cat("\n--- Complete Milestone (text format) ---\n")
#>
#> --- Complete Milestone (text format) ---
print_milestone(halley$mid)
#> [1701] 1st contour map?
#> Authors: Edmond Halley
#>
#> Contour maps showing curves of equal value (an isogonic map, lines of equal magnetic declination for the world, possibly the first contour map of a data-based variable)
#>
#> Keywords: contour map, isogonic
#> Subjects: Physical
#> Aspects: Statistics & Graphics
#>
#> Media:
#>   - [link] National maritime museum, Halley magnetic chart
#>   - [image] Halley isogonic map
#>   - [link] Halley biography
#>   - [link] Geomagnetism: early concept of the North Magnetic Pole - The concept of the North Magnetic Pole arose from the desire of early European navigators to explain the directional properties of the compass. Chines used compass at least as early as the 1st century and it was imported to Europe in the 12th century.
#>
#> References:
#>   - Halley, Edmund. (1701). "The Description and Uses of a New, and Correct Sea-Chart of the Whole World, Shewing Variations of the Compass"
#>   - Abbott, Edwin A. (1884). "Flatland: A Romance of Many Dimensions". Cutchogue, NY: Buccaneer Books. [(1976 reprint of the 1884 edition)]
Working with references
# Get references for a milestone
refs <- get_milestone_references(53)
cat("References for milestone 53:\n")
#> References for milestone 53:
refs |>
  subset(select = c(rid, bibtexkey, author, year)) |>
  print()
#>   rid   bibtexkey          author year
#> 1 290 Halley:1701  Halley, Edmund 1701
#> 2 365 Abbott:1884 Abbott, Edwin A 1884

# Print formatted reference
cat("\nFormatted reference (text):\n")
#>
#> Formatted reference (text):
print_reference(refs$rid[1])
#> Halley, Edmund. (1701). "The Description and Uses of a New, and Correct Sea-Chart of the Whole World, Shewing Variations of the Compass"

# Print as BibTeX
cat("\nAs BibTeX:\n")
#>
#> As BibTeX:
print_reference(refs$rid[1], bibtex = TRUE)
#> @article{Halley:1701,
#>   author = {Halley, Edmund},
#>   title = {The Description and Uses of a New, and Correct Sea-Chart of the Whole World, Shewing Variations of the Compass},
#>   year = {1701},
#>   publisher = {Author},
#>   address = {London}
#> }
Searching milestones
The package provides flexible search functions for finding milestones by text, keywords, or authors. The search term can be a regular expression (via grepl()).
# Full-text search for "statistical" in descriptions, tags, and notes
stat_ids <- search_milestones("statistical")
cat("Found", length(stat_ids), "milestones mentioning 'statistical'\n")
#> Found 51 milestones mentioning 'statistical'
cat("First 5:", paste(head(stat_ids, 5), collapse = ", "), "\n")
#> First 5: 36, 38, 55, 76, 94

# Use regex to find "chart" OR "graph"
chart_ids <- search_milestones("chart|graph", fields = c("description", "tag"))
cat("\nFound", length(chart_ids), "milestones with 'chart' or 'graph'\n")
#>
#> Found 132 milestones with 'chart' or 'graph'

# Search by keyword
contour_ids <- search_keywords("contour")
cat("\nMilestones tagged with 'contour':", paste(contour_ids, collapse = ", "), "\n")
#>
#> Milestones tagged with 'contour': 65, 117, 145, 83, 53

# Search by author name
playfair_ids <- search_authors("Playfair")
cat("\nWilliam Playfair's milestones:", paste(playfair_ids, collapse = ", "), "\n")
#>
#> William Playfair's milestones: 80, 89

# Get formatted output for one result
cat("\nFormatted milestone:\n")
#>
#> Formatted milestone:
search_milestones("Florence Nightingale", fields = "description", output = "print")
#> [1829] Polar-area charts
#> Authors: André Michel Guerry
#>
#> Polar-area charts (predating those by Florence Nightingale cite{Nightingale:1857}), showing frequency of events for cyclic phenomena
#>
#> Location: France
#> Keywords: chart!polar, coxcomb
#> Subjects: Physical
#> Aspects: Statistics & Graphics
#>
#> Media:
#>   - [image] Guerry's polar diagrams
#>   - [image] Guerry barcharts and polar diagrams
#>
#> Note: The plate shows six polar diagrams for daily phenomena: direction of the wind in 8 sectors, births and deaths by hour of theday.
#>
#> References:
#>   - Balbi, Adriano & Guerry, André-Michel. (1829). "Tableau des Variations météorologique comparées aux phénomènes physiologiques, d'aprés les observations faites à l'Obervatoire royal, et les recherches statistique les plus récentes". _Annales d'Hygiène Publique et de Médecine Légale_. 1. pp. 228-
Filtering by date
# Find milestones from a specific time period
ms_1800s <- ms |>
  subset(date_from_numeric >= 1800 & date_from_numeric < 1900)
cat("Number of milestones from 1800-1899:", nrow(ms_1800s), "\n")
#> Number of milestones from 1800-1899: 98
cat("First few:\n")
#> First few:
ms_1800s |>
  subset(select = c(mid, date_from, tag)) |>
  head(3) |>
  print()
#>    mid date_from                         tag
#> 87  87      1800            Coordinate paper
#> 88  88      1800 Automatic time-series graph
#> 89  89      1801                   Pie chart
See also
The original Milestones website. It started out as a LaTeX document. A collection of Perl scripts was used to fashion it into a set of HTML pages.
PDF version: Milestones in the History of Thematic Cartography, Statistical Graphics, and Data Visualization
A visual overview of milestones designed by Mario Kanno
References
Friendly, M. (2005). Milestones in the History of Data Visualization: A Case Study in Statistical Historiography. In C. Weihs & W. Gaul (Eds.), Classification: The Ubiquitous Challenge (pp. 34–52). Springer. http://datavis.ca/papers/gfkl.pdf
Friendly, M., Sigal, M. & Harnanansingh, D. (2015). “The Milestones Project: A Database for the History of Data Visualization.” In Kimball, M. & Kostelnick, C. (Eds.) Visible Numbers: The History of Data Visualization, Chapter 10. London, UK: Ashgate Press. preprint