About Me

Michael Friendly
datavis.ca [Legacy web site]
 dataVisFriendly [BlueSky]
friendly [GitHub]
vis.social/@datavisFriendly [Mastodon]
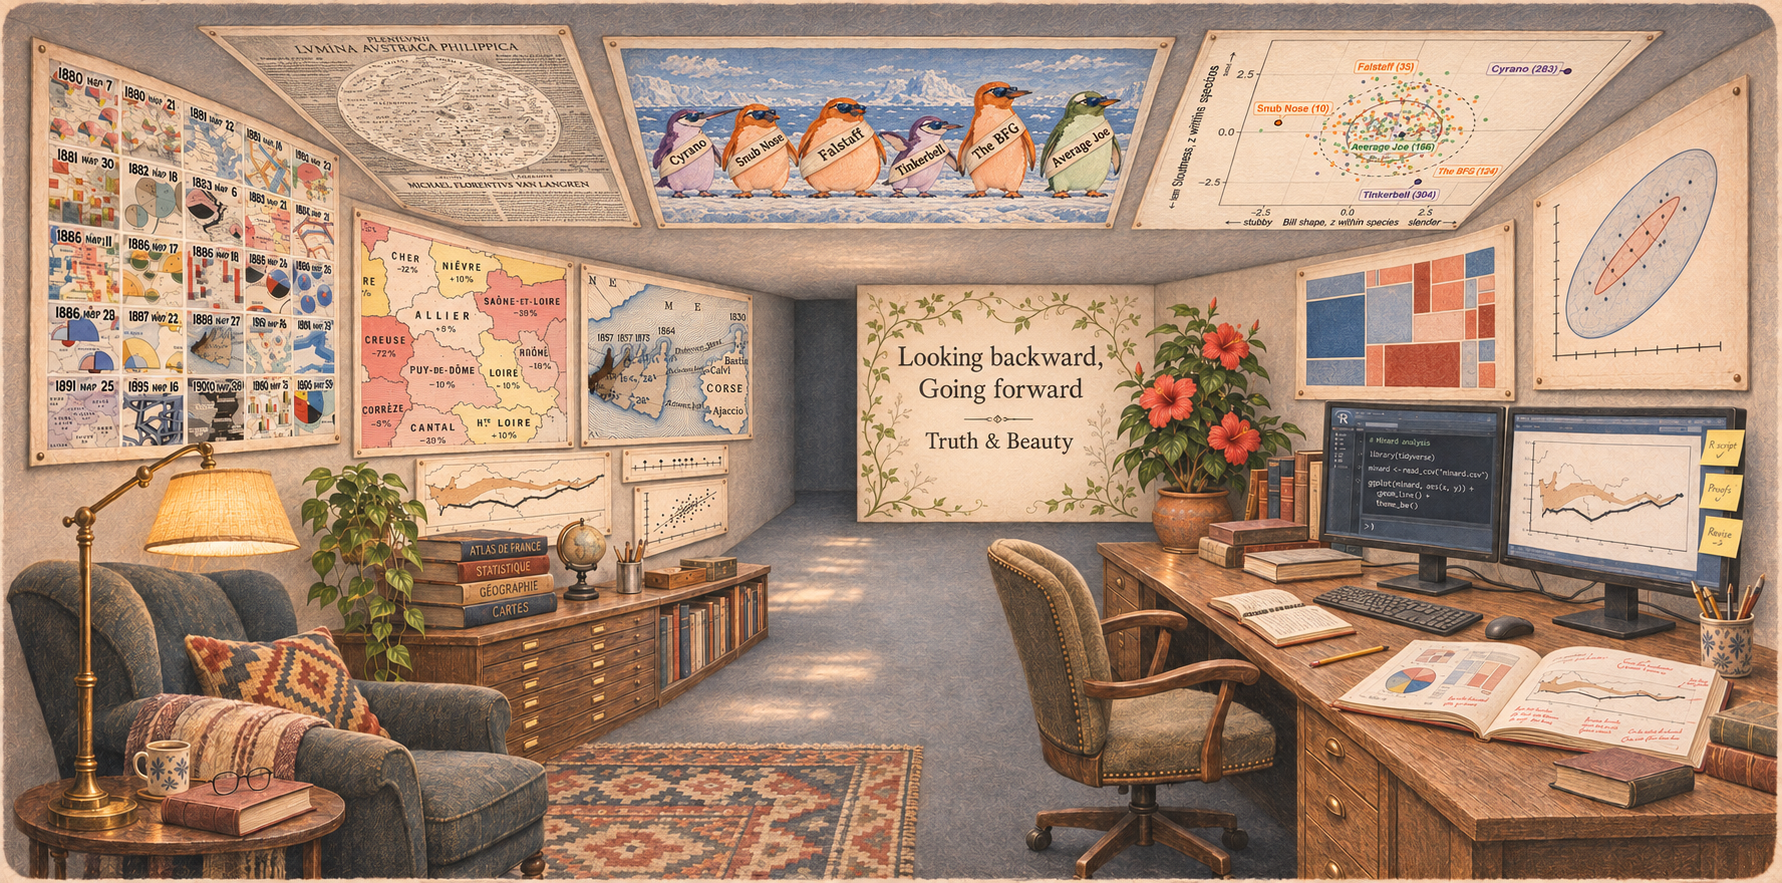
Michael Friendly is a Fellow of the American Statistical Association, Professor of Psychology and coordinator of the Statistical Consulting Service at York University. He is an associate editor of the Journal of Computational and Graphical Statistics and has served as an editorial collaborator for many other journals. He received his Ph.D. in psychometrics and cognitive psychology from Princeton University.
His current research work includes the development of graphical methods for data visualization, where he is a principal innovator of novel methods for relatively “un-vizzed” problems, including visualizing categorical data (Visualizing Categorical Data, 2000; Discrete Data Analysis with R, with David Meyer, 2016) and multivariate data, the subject of his book Visualizing Multivariate Data and Models in R. Along with this, he is the author and maintainer of many R packages.
His passion for the deep roots of modern graphical methods led him to become a world-known amateur historian of data visualization. In the latter, he directs The Milestones Project, a comprehensive catalog and database of the principal developments in the histories of thematic cartography, statistical graphics and data visualization. He is a founder of an international group, Les Chevaliers des Albums de Statistique Graphique, devoted to this history and is author of multiple books and research papers on these topics. His most recent book in this area, with Howard Wainer, is A History of Data Visualization and Graphic Communication (Harvard University Press, 2021).