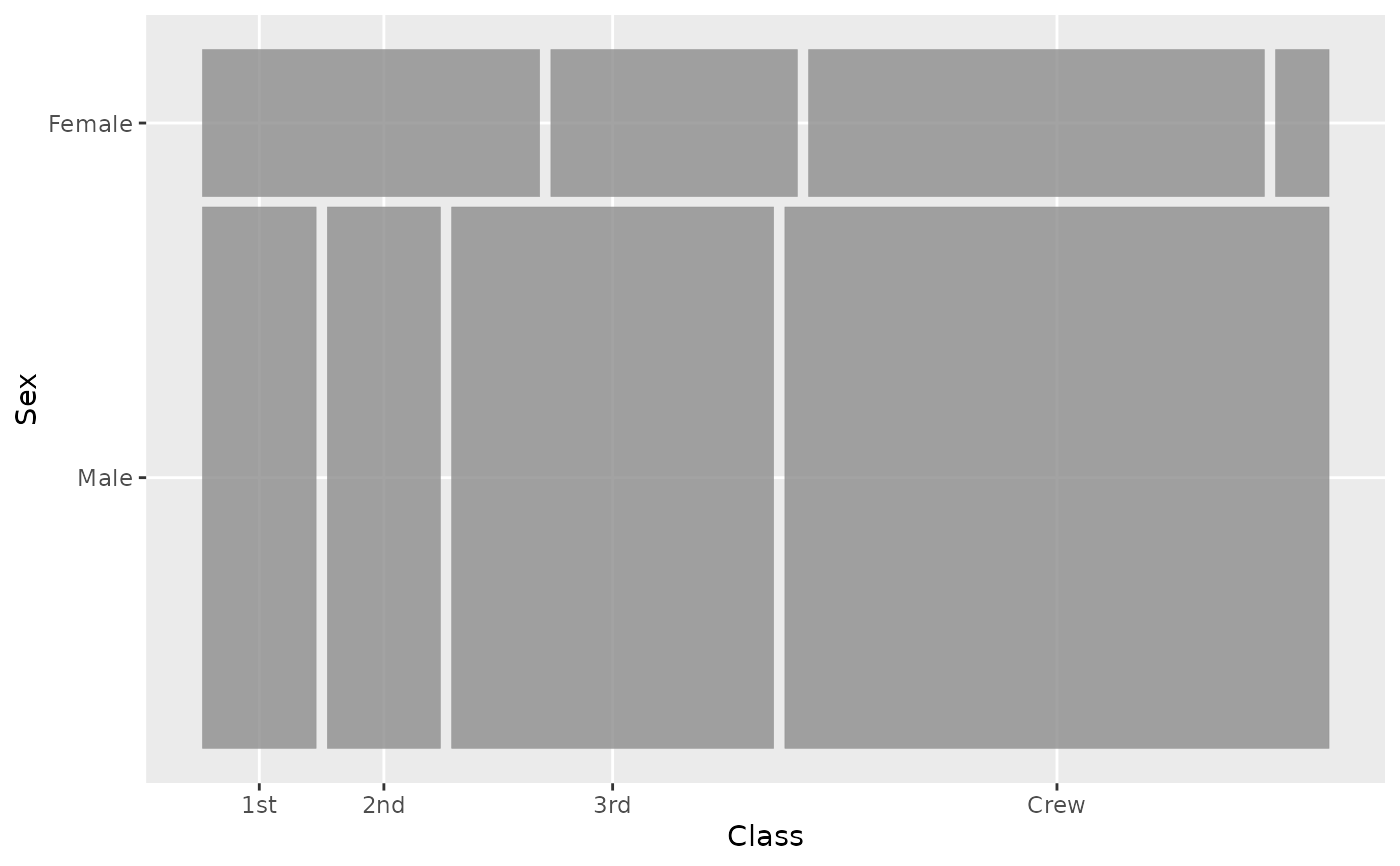
Template for a double decker plot. A double decker plot is composed of a sequence of spines in the same direction, with the final spine in the opposite direction.
Source:R/divider.R
ddecker.RdTemplate for a double decker plot. A double decker plot is composed of a sequence of spines in the same direction, with the final spine in the opposite direction.
Value
A function of one argument, the number of splits n, that returns
a character vector of divider function names ("hspine"/"vspine") to
apply at each split – suitable for the divider argument of
geom_mosaic() and related layers.
Examples
data(titanic)
ggplot(data = titanic, aes(x = product(Class, Sex))) +
  geom_mosaic(divider = ddecker("v"))