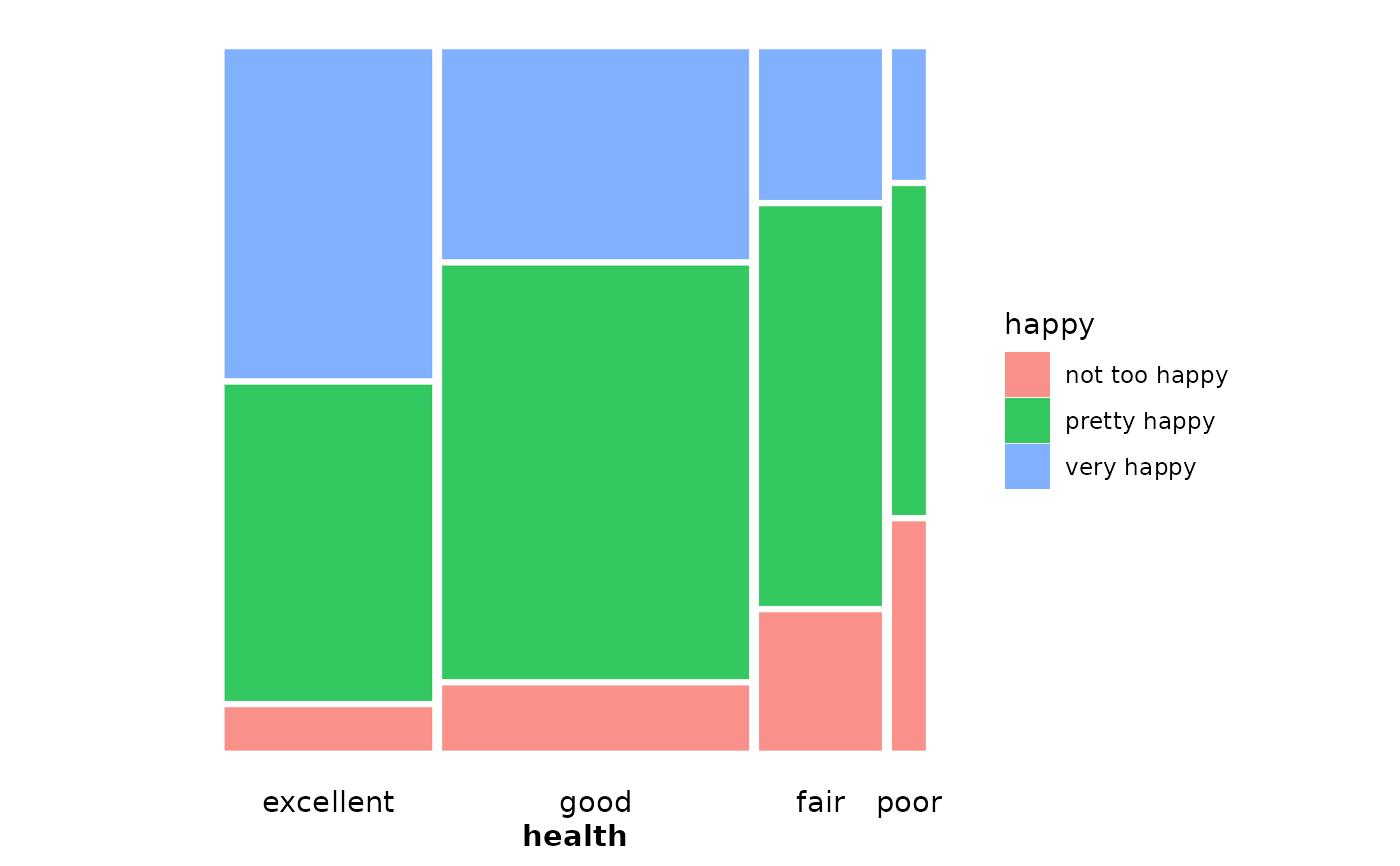
Themes set the general aspect of the plot such as the color of the
background, gridlines, the size and color of fonts.
theme_mosaic provides access to the regular ggplot2 theme, but removes
any background, axes ticks, most of the gridlines, and ensures an aspect
ratio of 1 for better viewing of the mosaics. This theme also applies a bold
face to axes labels and allows for the convenient rotation of category labels.
Arguments
- base_size
Base font size. Defaults to 11.
- base_family
Base font family. Defaults to
"", which uses the graphics device's default font family.- rot_labels
The angle (in degrees) used to rotate category labels. Defaults to 0 degrees, relative to the current axis orientation.
- ...
Additional arguments passed to
ggplot2::theme(). These are applied after the mosaic theme defaults and can therefore override them.
Details
As with other ggplot2 extensions, themes set the general look-and-feel of the plot such as the color of the background, gridlines, the size and color of fonts. theme_mosaic() provides access to the regular ggplot2 theme, but: removes any background, axes ticks, most of the gridlines, and ensures an aspect ratio of 1 for better viewing of the mosaics. This theme also applies a bold face to axes labels and allows for the convenient rotation of category labels to avoid overlap