This function finds the unique tags of items in the quotes database and returns them as vector or a one-way table giving their frequencies.
Value
Returns either a vector of tags in the quotes database or a one-way frequency table of the number of quotes for each tag.
Examples
quote_tags()
#> [1] "Box quotes" "Ockham's razor" "anova"
#> [4] "assumptions" "averages" "bayesian"
#> [7] "biometry" "clustering" "computing"
#> [10] "correlation" "counts" "data"
#> [13] "data analysis" "data visualization" "design"
#> [16] "eda" "ellipses" "ethics"
#> [19] "experimental design" "expt design" "generalizations"
#> [22] "geometry" "history" "knowledge"
#> [25] "lsmeans" "milestones" "modeling"
#> [28] "models" "nhst" "normality"
#> [31] "numeracy" "outliers" "p-values"
#> [34] "pictures" "power" "prediction"
#> [37] "probability" "programming" "random numbers"
#> [40] "research" "reviews" "sample size"
#> [43] "sampling" "science" "significance"
#> [46] "skewness" "space" "statistician"
#> [49] "statisticians" "statistics" "tables"
#> [52] "teaching" "tidy data" "time"
#> [55] "time series" "uncertainty" "vision"
quote_tags(table=TRUE)
#> tags
#> Box quotes Ockham's razor anova assumptions
#> 5 1 3 1
#> averages bayesian biometry clustering
#> 7 19 2 1
#> computing correlation counts data
#> 38 1 5 105
#> data analysis data visualization design eda
#> 29 105 3 8
#> ellipses ethics experimental design expt design
#> 2 4 8 2
#> generalizations geometry history knowledge
#> 8 9 42 8
#> lsmeans milestones modeling models
#> 3 3 1 21
#> nhst normality numeracy outliers
#> 124 10 9 13
#> p-values pictures power prediction
#> 1 31 5 2
#> probability programming random numbers research
#> 16 2 10 1
#> reviews sample size sampling science
#> 4 1 10 86
#> significance skewness space statistician
#> 48 1 2 7
#> statisticians statistics tables teaching
#> 2 158 9 1
#> tidy data time time series uncertainty
#> 4 24 2 7
#> vision
#> 18
library(ggplot2)
qt <- quote_tags(table=TRUE)
qtdf <-as.data.frame(qt)
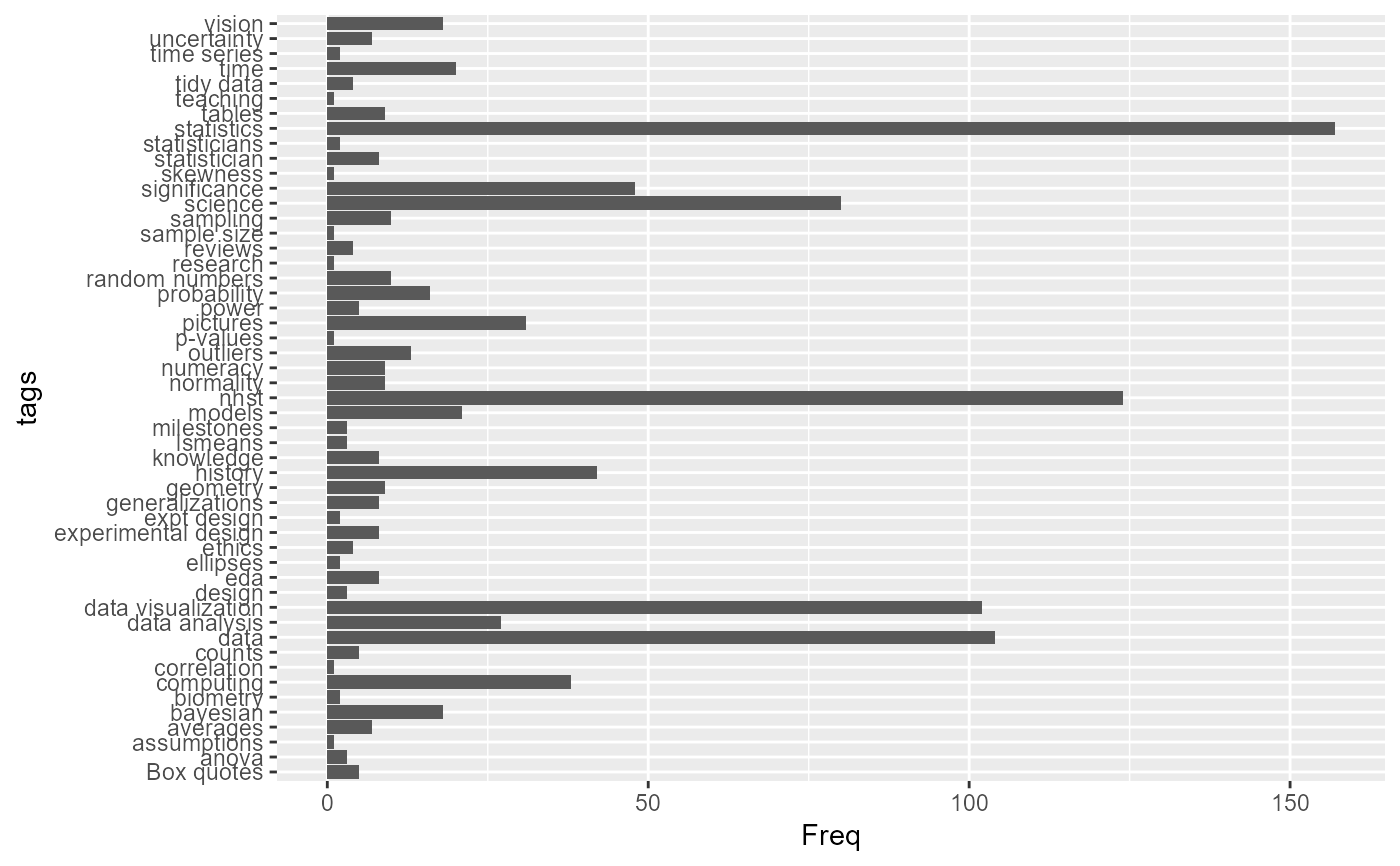
# bar plot of frequencies
ggplot2::ggplot(data=qtdf, aes(x=Freq, y=tags)) +
geom_bar(stat = "identity")
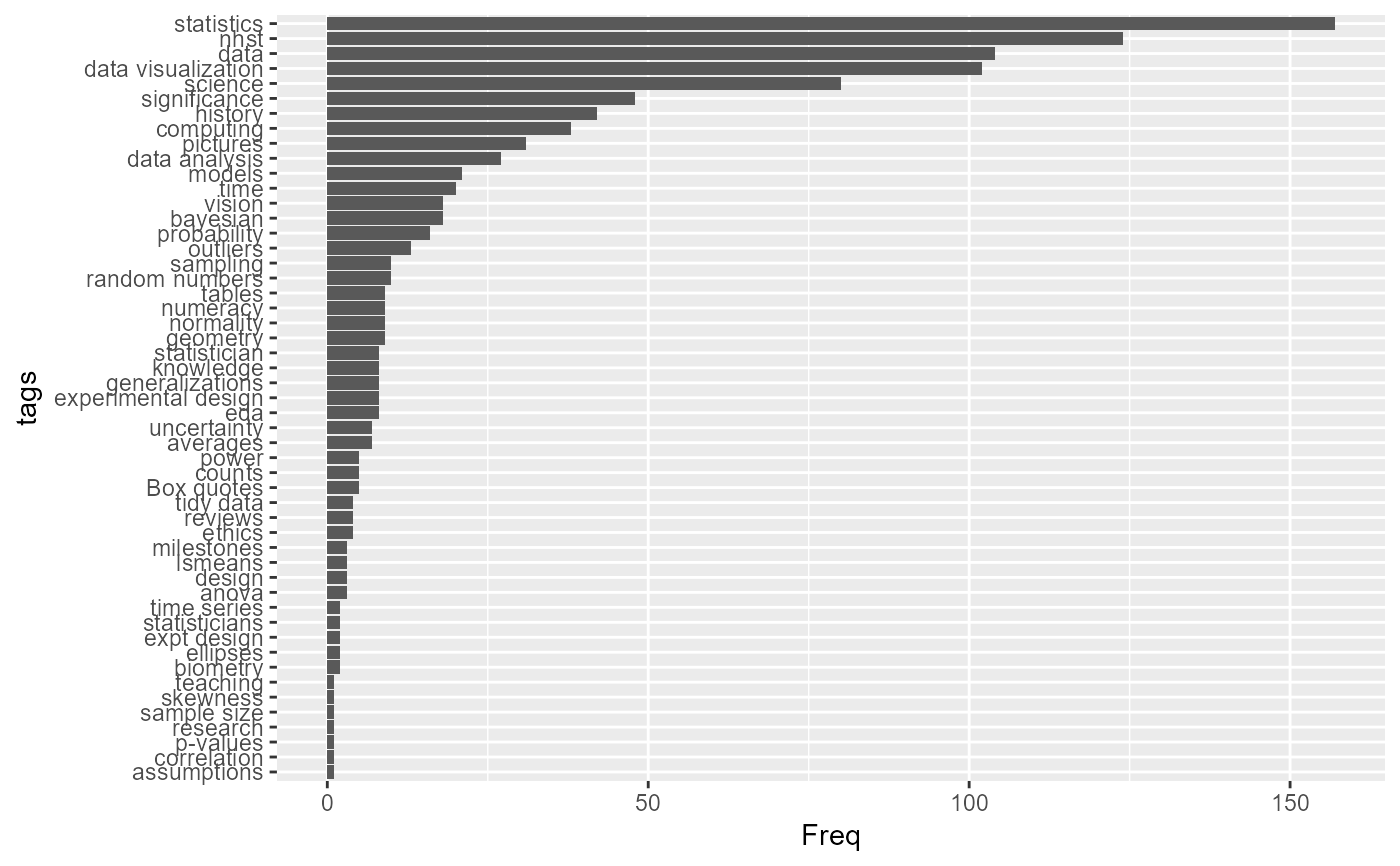
 # Sort tags by frequency
qtdf |>
dplyr::mutate(tags = forcats::fct_reorder(tags, Freq)) |>
ggplot2::ggplot(aes(x=Freq, y=tags)) +
geom_bar(stat = "identity")
# Sort tags by frequency
qtdf |>
dplyr::mutate(tags = forcats::fct_reorder(tags, Freq)) |>
ggplot2::ggplot(aes(x=Freq, y=tags)) +
geom_bar(stat = "identity")