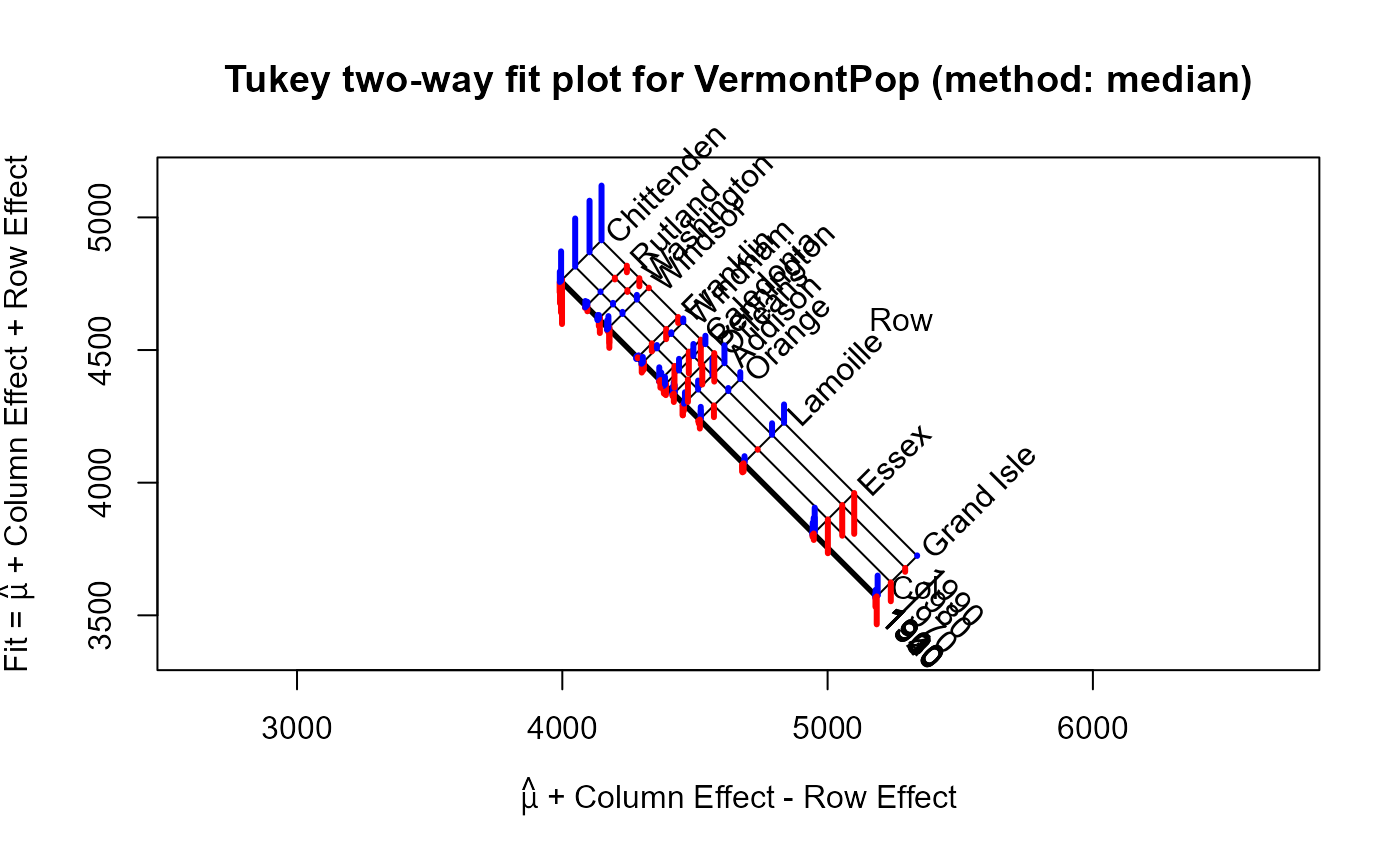
Vermont country populations from the US Census, 1900-1990
References
Morgenthaler, Stephan, and John W. Tukey. “Multipolishing and Two-Way Plots.” Metrika 53.3 (2001): 245–267.
Examples
options(digits=4)
VP <- twoway(VermontPop,
             method="median",
             responseName = "log Population")
VP
#>
#> Median polish decomposition (Dataset: "VermontPop"; Response: log Population)
#> Residuals bordered by row effects, column effects, and overall
#>
#>              1900 1910 1920 1930 1940 1950 1960 1970 1980 1990   roweff
#>            + ---- ---- ---- ---- ---- ---- ---- ---- ---- ---- + ----
#> Chittenden | -167 -137 -120  -81  -39   40  111  182  195  206 :  383
#> Rutland    |  -23   13    0   24   -1    1    3    2   -7  -25 :  287
#> Washington |  -58   -2  -28    6    6   18   13    6   -7  -31 :  240
#> Windsor    |  -78  -59  -14   -6    1   34   45    8   18   -2 :  204
#> Franklin   |    4   -1    5    9    4    8   -3  -30  -38  -23 :   94
#> Windham    |  -30  -26  -32  -34   -3   11   21   13    7   14 :   75
#> Caledonia  |   -3   25   24   52    5   -1  -29  -82  -82  -94 :    9
#> Bennington |  -36  -43  -35  -30  -16   17   29   44   46   32 :   -9
#> Orleans    |    3   28   43   30    6   -5  -32  -85  -73 -108 :  -42
#> Addison    |   40    0  -26  -40  -38   -4    5   34   63   68 :  -80
#> Orange     |   44   30    0  -11   -1   -2  -34  -44   12   26 : -140
#> Lamoille   |   13   23    1  -30  -26  -12  -31   -2   44   69 : -305
#> Essex      |   94   56   59   44    9   -8  -25 -128 -116 -154 : -570
#> Grand Isle |   75    0    7   29   14  -35 -105  -72  -15    2 : -807
#>            + .... .... .... .... .... .... .... .... .... .... + ....
#> coleff     |    3    3   -1   -4   -6   -5    0   53  107  152 : 4379
#>
plot(VP)

