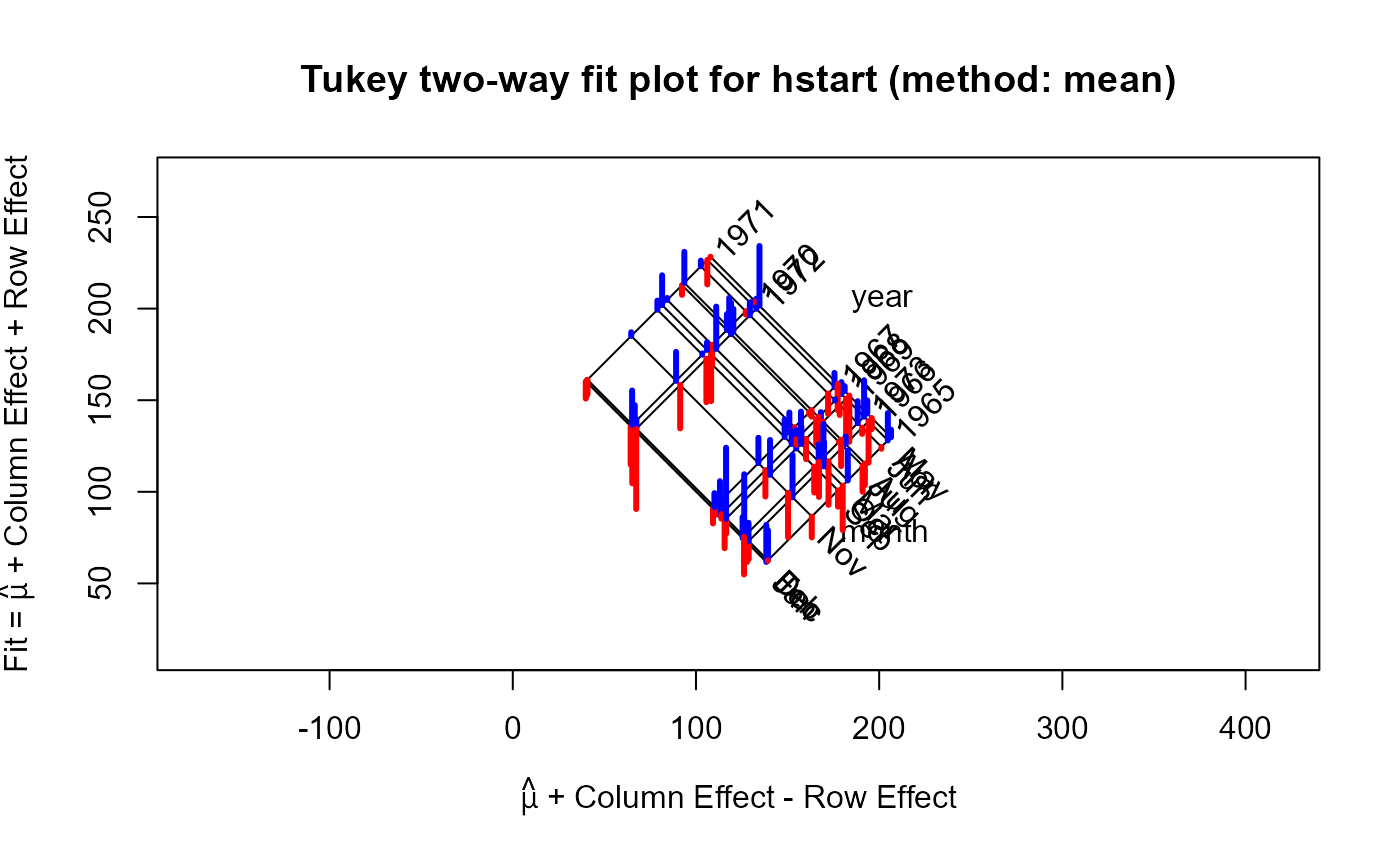
Number of U.S. housing starts by month for the years 1965 – 1973
References
Becker, Chambers & Wilks (1988), The New S Language, Brooks Cole. Friendly, M. (1991). SAS System for Statistical Graphics Cary, NC: SAS Institute, p.380
Examples
hstart.2way <- twoway(hstart, method="mean")
anova(hstart.2way)
#> Dataset: hstart; method: "mean"
#>
#> Analysis of Variance Table, assuming additivity
#>
#>           Df Sum Sq Mean Sq F value    Pr(>F)
#> row        8 112905 14113.2  50.971 < 2.2e-16 ***
#> col       11  64978  5907.1  21.334 < 2.2e-16 ***
#> Residuals 88  24366   276.9
#> ---
#> Signif. codes:  0 '***' 0.001 '**' 0.01 '*' 0.05 '.' 0.1 ' ' 1
#>
#>
#> Analysis of Variance Table, allowing non-additivity
#>
#>            Df Sum Sq Mean Sq F value  Pr(>F)
#> row         8 112905 14113.2 53.5510 < 2e-16 ***
#> col        11  64978  5907.1 22.4139 < 2e-16 ***
#> nonadd      1   1437  1437.2  5.4534 0.02183 *
#> pure error 87  22929   263.5
#> ---
#> Signif. codes:  0 '***' 0.001 '**' 0.01 '*' 0.05 '.' 0.1 ' ' 1
plot(hstart.2way)