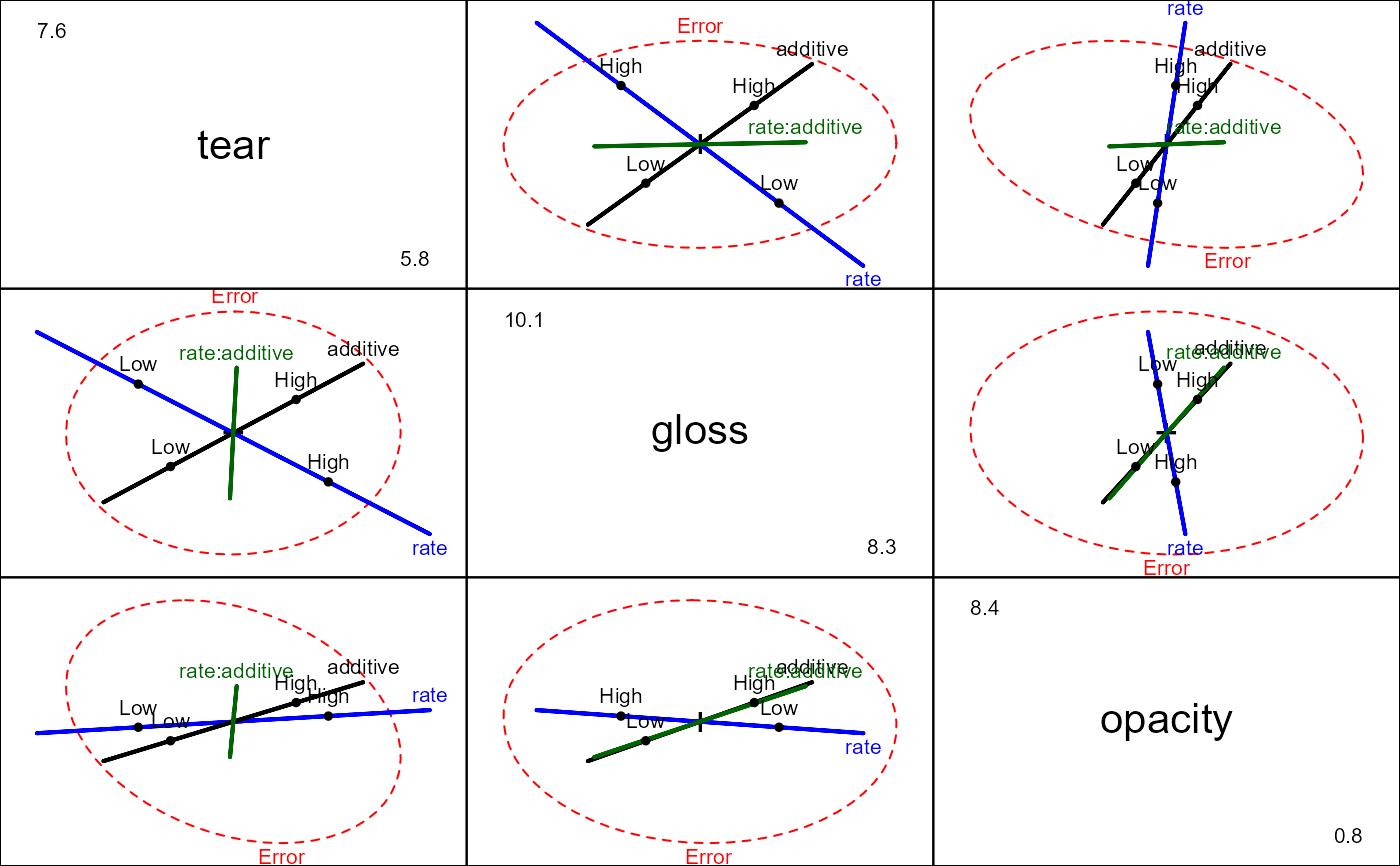
An experiment was conducted to determine the optimal conditions for extruding plastic film. Three responses were measured in relation to two factors, change in rate of extrusion and amount of an additive, both with two levels and \(n=5\) observations per cell.
Format
A data frame with 20 observations on the following 5 variables.
teara numeric vector: tear resistance
glossa numeric vector: film gloss
opacitya numeric vector: film opacity
ratea factor representing change in the rate of extrusion with levels
Low(-10%),High(10%)additivea factor with levels
Low(1.0%),High(1.5%)
Source
Johnson, R.A. & Wichern, D.W. (1992). Applied Multivariate Statistical Analysis, 3rd ed., Prentice-Hall. Example 6.12 (p. 266).
References
Krzanowski, W. J. (1988). Principles of Multivariate Analysis. A User's Perspective. Oxford. (p. 381)
Examples
str(Plastic)
#> 'data.frame':	20 obs. of  5 variables:
#>  $ tear    : num  6.5 6.2 5.8 6.5 6.5 6.9 7.2 6.9 6.1 6.3 ...
#>  $ gloss   : num  9.5 9.9 9.6 9.6 9.2 9.1 10 9.9 9.5 9.4 ...
#>  $ opacity : num  4.4 6.4 3 4.1 0.8 5.7 2 3.9 1.9 5.7 ...
#>  $ rate    : Factor w/ 2 levels "Low","High": 1 1 1 1 1 1 1 1 1 1 ...
#>  $ additive: Factor w/ 2 levels "Low","High": 1 1 1 1 1 2 2 2 2 2 ...
plastic.mod <- lm(cbind(tear, gloss, opacity) ~ rate*additive, data=Plastic)
car::Anova(plastic.mod)
#>
#> Type II MANOVA Tests: Pillai test statistic
#>               Df test stat approx F num Df den Df   Pr(>F)
#> rate           1   0.61814   7.5543      3     14 0.003034 **
#> additive       1   0.47697   4.2556      3     14 0.024745 *
#> rate:additive  1   0.22289   1.3385      3     14 0.301782
#> ---
#> Signif. codes:  0 '***' 0.001 '**' 0.01 '*' 0.05 '.' 0.1 ' ' 1

pairs(plastic.mod)