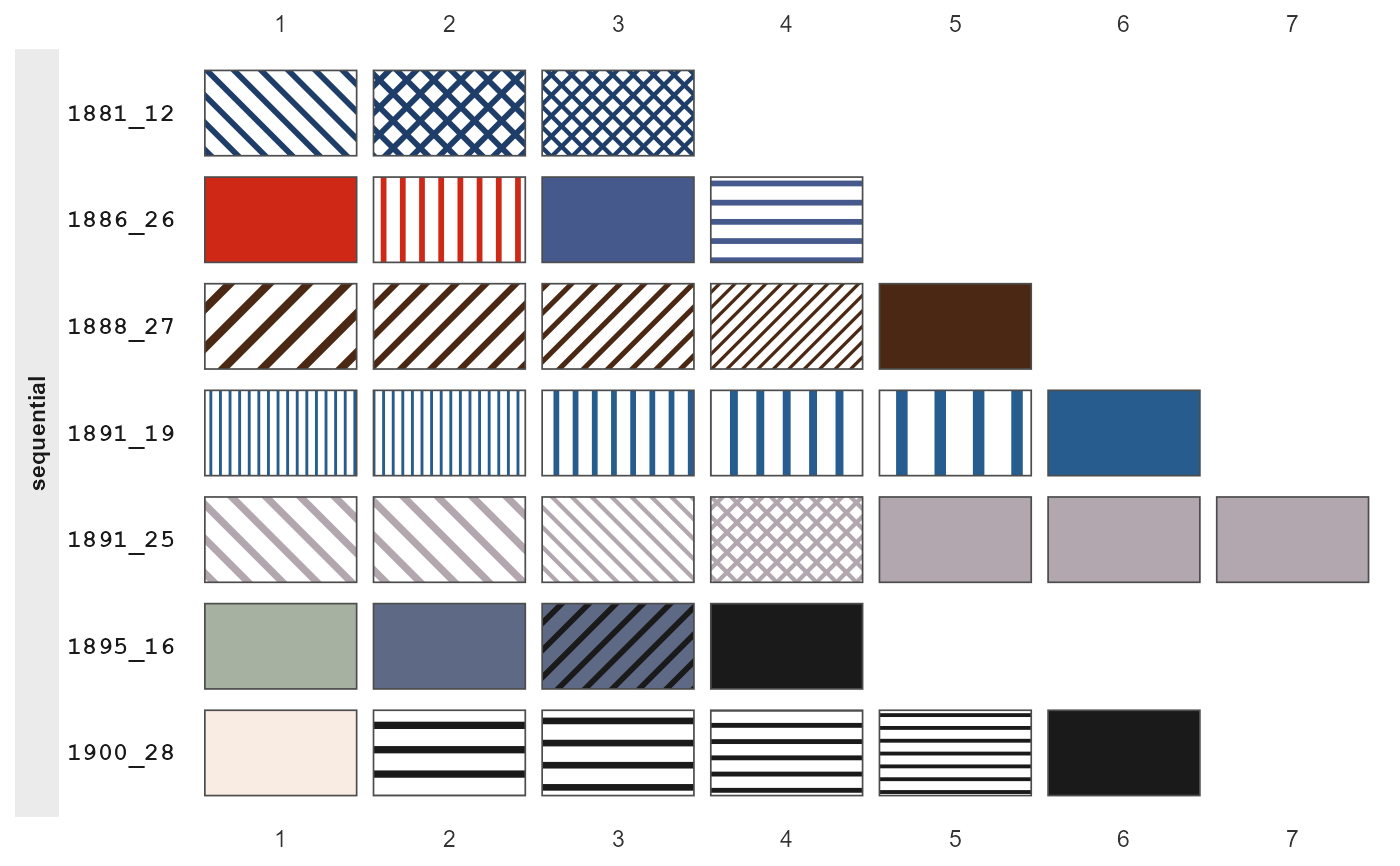
Draws an atlas of the swatches (see cheysson_swatches): one row per
palette, one column per element, with the rows grouped into panels by
palette type. Each cell is drawn by the registered swatch itself, so the
swatch for a cell is named by its row and column, e.g. row 1886_28,
column 3 is "1886_28-3".
Examples
if (requireNamespace("ggpattern", quietly = TRUE)) {
  show_swatches("sequential")
}