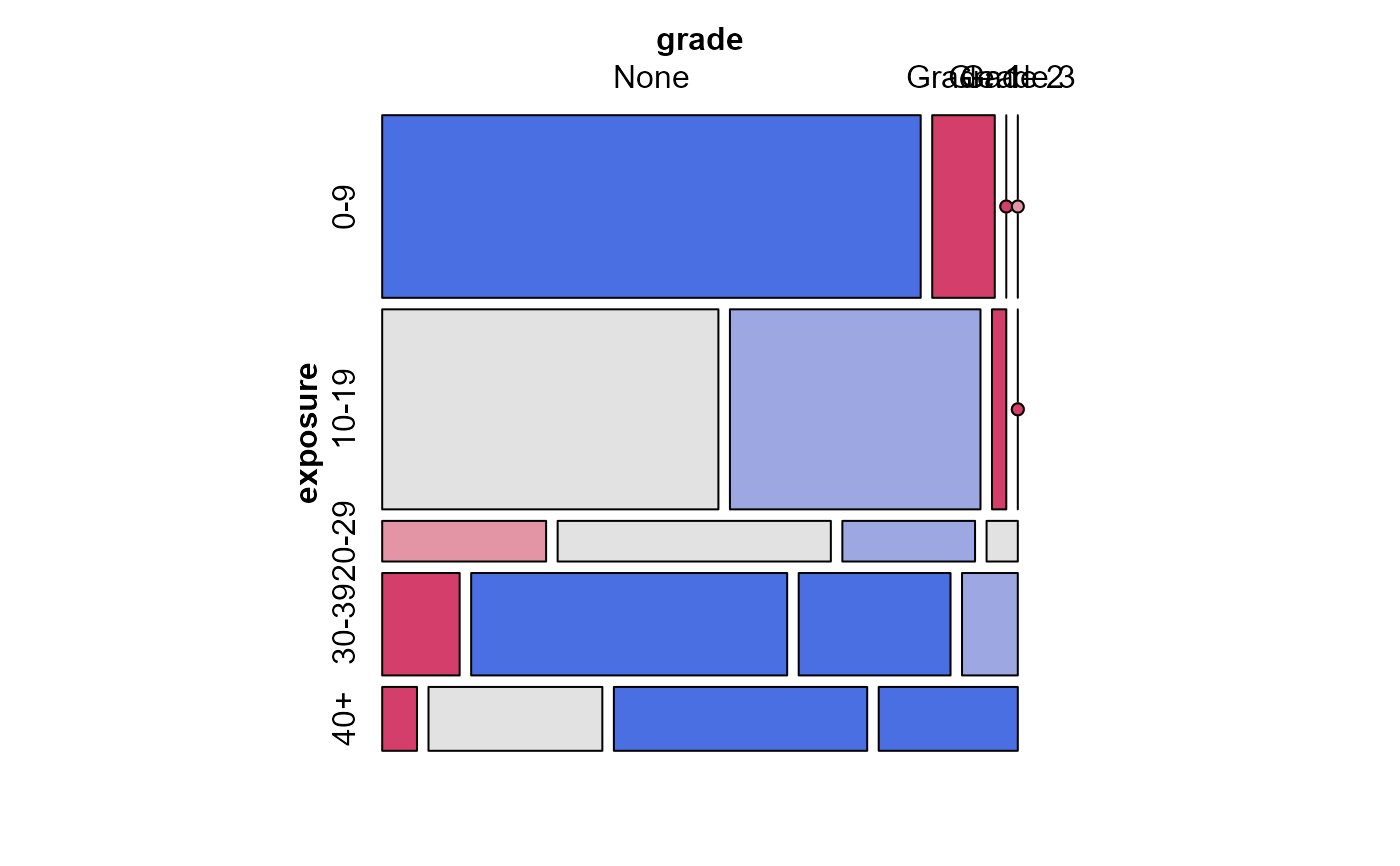
A two-way contingency table formed from the cross-classification of the number of years of occupational exposure to asbestos and the diagnosed severity of asbestosis of 1117 New York workers. Asbestosis is a chronic lung disease that results in the lung tissue being scared due to contact with the fibers which can lead to severe breathing difficulties.
Format
The format is:
 num [1:5, 1:4] 310 212 21 25 7 36 158 35 102 35 ...
 - attr(*, "dimnames")=List of 2
  ..$ exposure: chr [1:5] "0-9" "10-19" "20-29" "30-39" ...
  ..$ grade   : chr [1:4] "None" "Grade 1" "Grade 2" "Grade 3"#'
Source
Beh, E. J. & Lombardo, R. (2022). Features of the Polynomial Biplot for Ordered Contingency Tables, Journal of Computational and Graphical Statistics, 31:2, 403-412, DOI: 10.1080/10618600.2021.1990773, Table 1.
Details
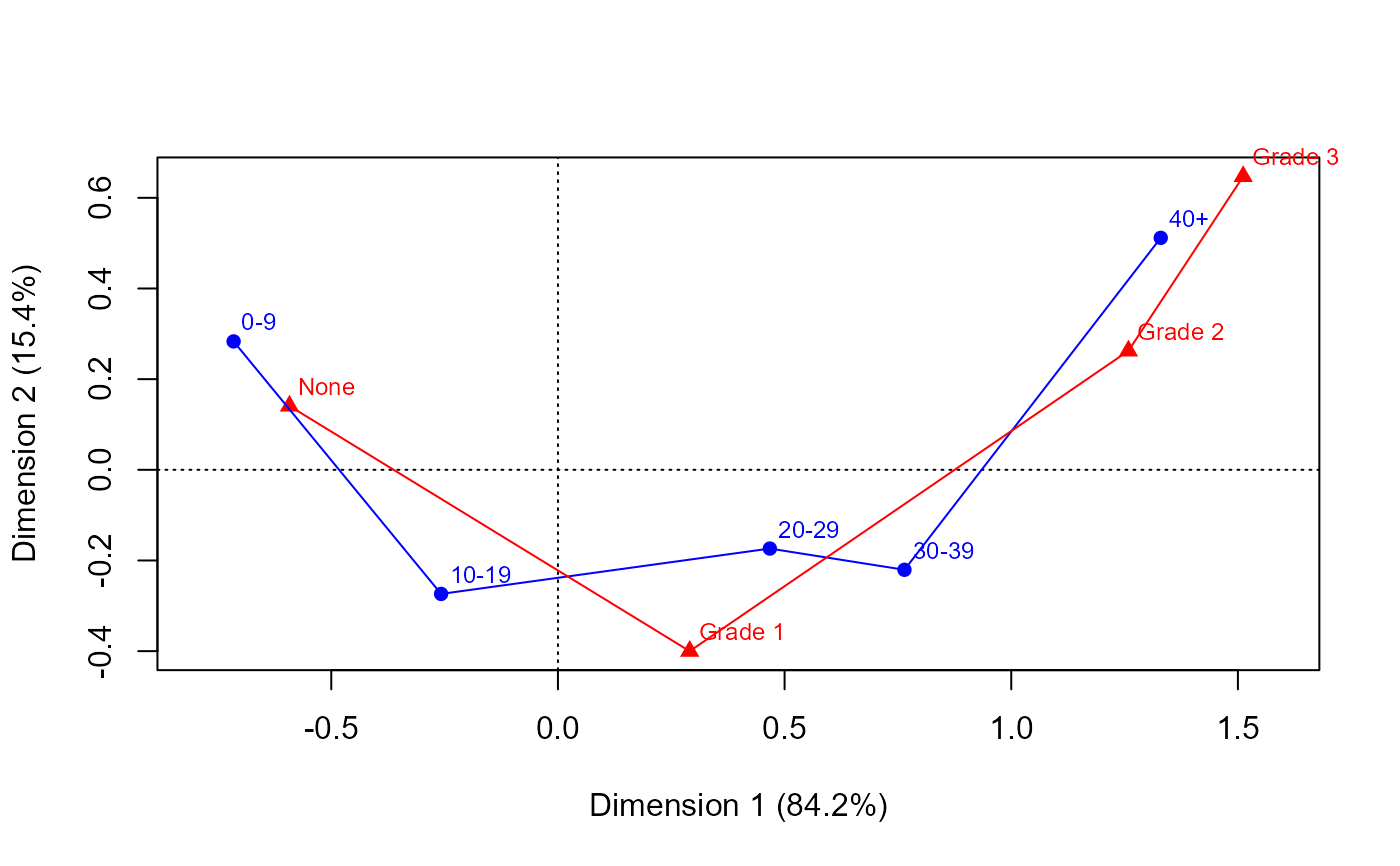
exposure and grade should be regarded as ordered factors. Beh
and Lombardo (2022) use this data to illustrate a polynomial biplot for
ordered categories.
The data summarized here was studied by Beh and Smith (2011) and comes from the original data collected and published by Selikoff (1981) who examined the link between asbestos exposure and asbestosis severity in 1963.
References
Beh, E. J., and D. R. Smith (2011b), Real World Occupational Epidemiology, Part 2: A Visual Interpretation of Statistical Significance, Archives of Environmental & Occupational Health, 66, 245-248.
Selikoff, I. J. (1981), Household Risks With Inorganic Fibers, Bulletin of the New York Academy of Medicine, 57, 947-961.