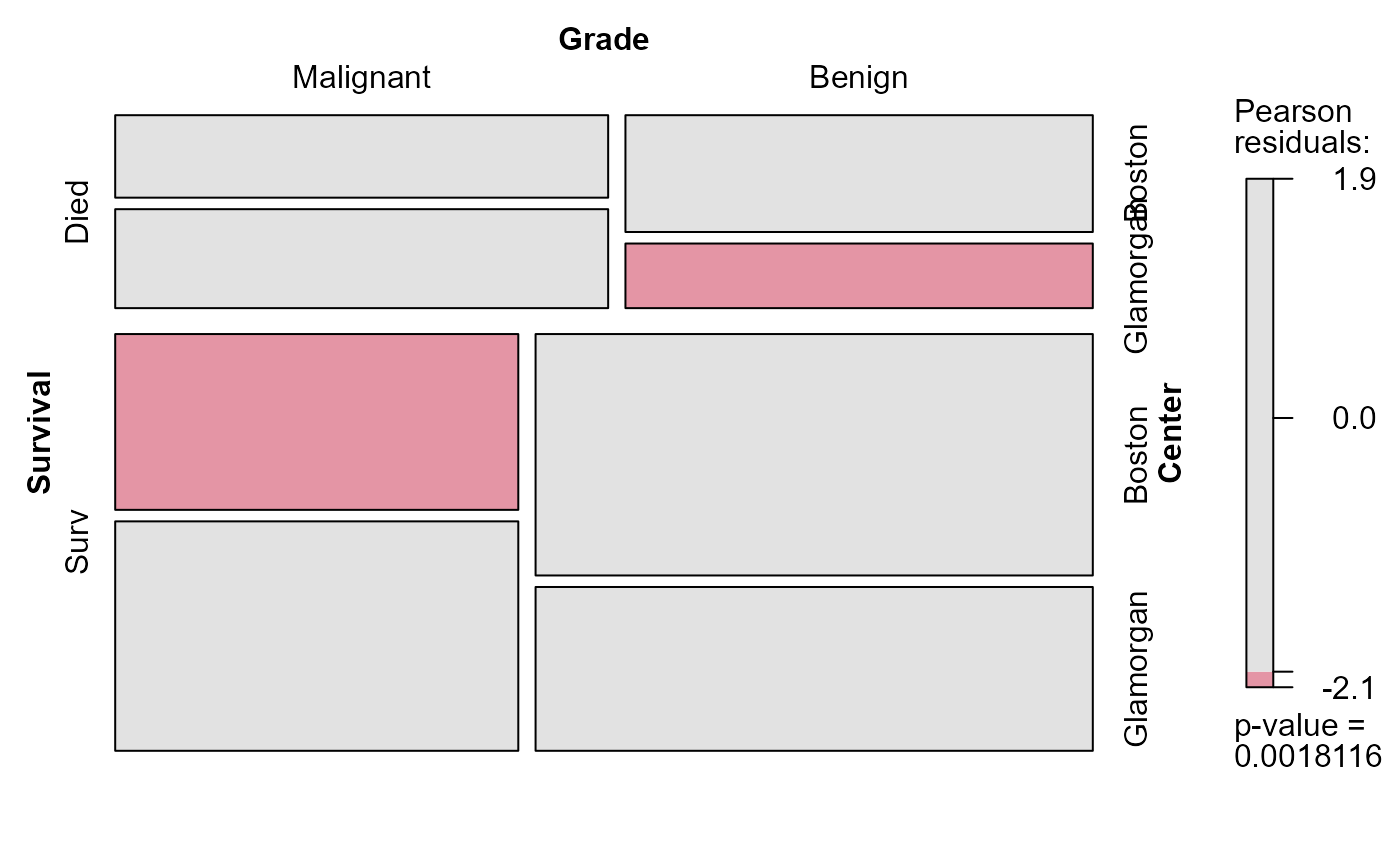
Three year survival of 474 breast cancer patients according to nuclear grade
and diagnostic center.
A 3-dimensional array resulting from cross-tabulating 3 variables
for 474 observations. The variable names and their levels are:
| dim | Name | Levels |
| 1 | Survival | "Died", "Surv" |
| 2 | Grade | "Malignant", "Benign" |
| 3 | Center | "Boston", "Glamorgan" |
Source
Lindsey, J. K. (1995).
Analysis of Frequency and Count Data Oxford, UK: Oxford University Press. p.
38, Table 2.5.
Whittaker, J. (1990) Graphical Models in Applied Multivariate Statistics New
York: John Wiley and Sons, p. 220.
Examples
data(Cancer)

MASS::loglm(~Survival + Grade + Center, data = Cancer)
#> Call:
#> MASS::loglm(formula = ~Survival + Grade + Center, data = Cancer)
#>
#> Statistics:
#>                       X^2 df    P(> X^2)
#> Likelihood Ratio 17.54776  4 0.001512235
#> Pearson          17.14492  4 0.001811552

vcd::mosaic(Cancer, shade=TRUE)