Data from Gart (1971) on the carcinogenic effects of a certain fungicide in
two strains of mice. Of interest is how the association between group
(Control, Treated) and outcome (Tumor, No Tumor) varies with
sex and strain of the mice.
Format
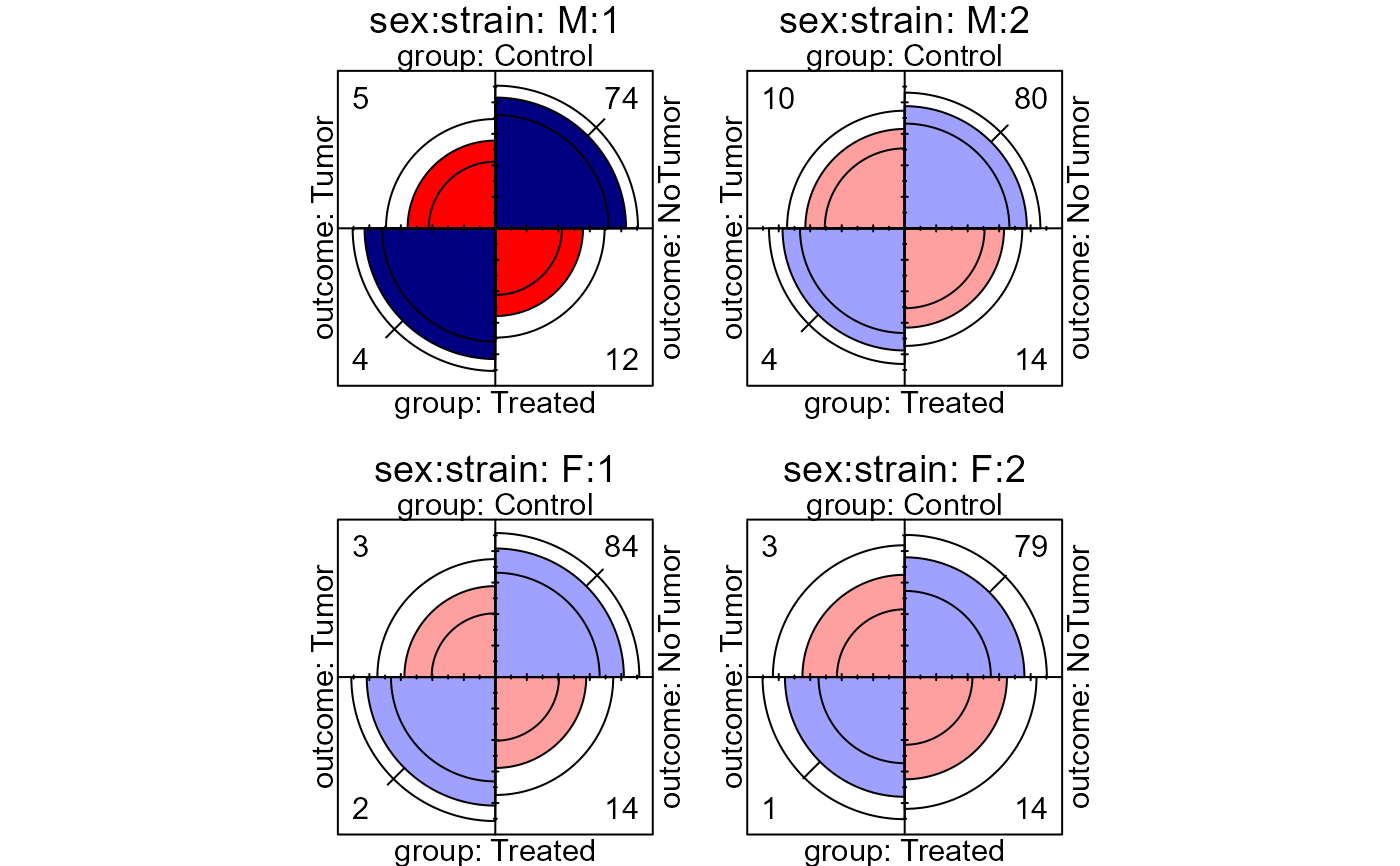
The data comprise a set of four 2 x 2 tables classifying 403 mice, either Control or Treated and whether or not a tumor was later observed. The four groups represent the combinations of sex and strain of mice.
The format is:
num [1:2, 1:2, 1:2, 1:2] 5 4 74 12 3 2 84 14 10 4 ...
- attr(*, "dimnames")=List of 4
..$ group  : chr [1:2] "Control" "Treated"
..$ outcome: chr [1:2] "Tumor" "NoTumor"
..$ sex    : chr [1:2] "M" "F"
..$ strain : chr [1:2] "1" "2"
Source
Gart, J. J. (1971). The comparison of proportions: a review of significance tests, confidence intervals and adjustments for stratification. International Statistical Review, 39, 148-169.
Details
Breslow (1976) used this data to illustrate the application of linear models to log odds ratios.
All tables have some small cells, so a continuity correction is recommended.
References
Breslow, N. (1976), Regression analysis of the log odds ratio: A method for retrospective studies, Biometrics, 32(3), 409-416.
Examples
data(Fungicide)
# loddsratio was moved to vcd; requires vcd_1.3-3+
fung.lor <- loddsratio(Fungicide, correct=TRUE)
fung.lor
#> log odds ratios for group and outcome by sex, strain
#>
#> strain
#> sex 1 2
#> M -1.584400 -0.8668107
#> F -1.426131 -0.8543105
confint(fung.lor)
#> 2.5 % 97.5 %
#> M:1 -2.966783 -0.2020162
#> F:1 -3.142095 0.2898333
#> M:2 -2.104615 0.3709934
#> F:2 -2.847243 1.1386222
# visualize odds ratios in fourfold plots
cotabplot(Fungicide, panel=cotab_fourfold)
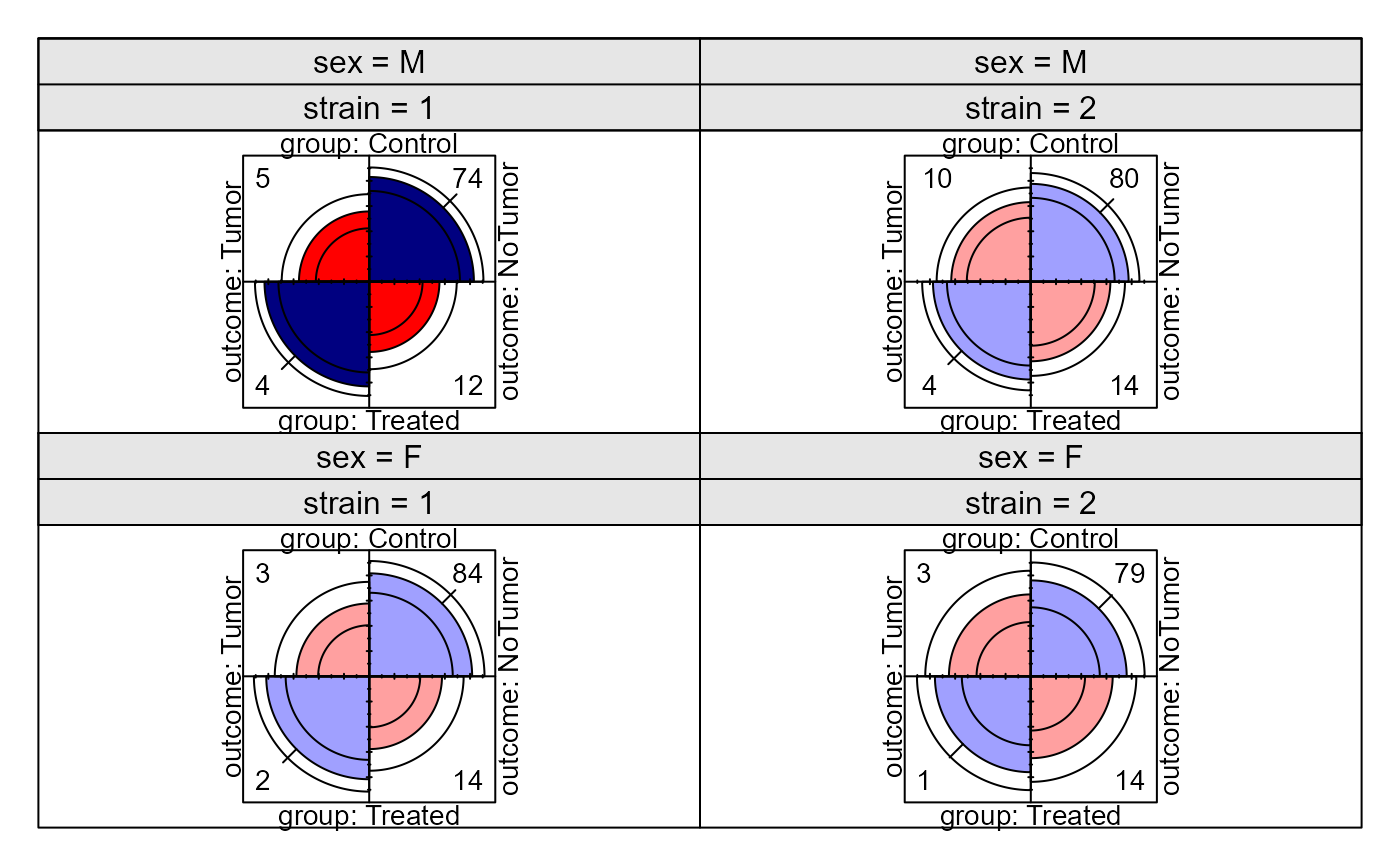 # -- fourfold() requires vcd >= 1.2-10
fourfold(Fungicide, p_adjust_method="none")
# -- fourfold() requires vcd >= 1.2-10
fourfold(Fungicide, p_adjust_method="none")