A three-way frequency table crossing eye color and hair color in two places, Caithness and Aberdeen, Scotland. These data were of interest to Fisher (1940) and others because there are mixtures of people of Nordic, Celtic and Anglo-Saxon origin.
Format
The format is:
  num [1:4, 1:5, 1:2] 326 688 343 98 38 116 84 48 241 584 ...
- attr(*, "dimnames")=List of 3
..$ Eye  : chr [1:4] "Blue" "Light" "Medium" "Dark"
..$ Hair : chr [1:5] "Fair" "Red" "Medium" "Dark" ...
..$ Place: chr [1:2] "Caithness" "Aberdeen"
Details
One or both tables have been widely analyzed in conjunction with RC and canonical correlation models for categorical data, e.g., Becker and Clogg (1989).
The hair and eye colors are ordered as in the original source, suggesting that they form ordered categories.
References
Becker, M. P., and Clogg, C. C. (1989). Analysis of Sets of Two-Way Contingency Tables Using Association Models. Journal of the American Statistical Association, 84(405), 142-151.
Fisher, R.A. (1940) The precision of discriminant functions. Annals of Eugenics, 10, 422-429.
Examples
data(HairEyePlace)
# separate mosaics
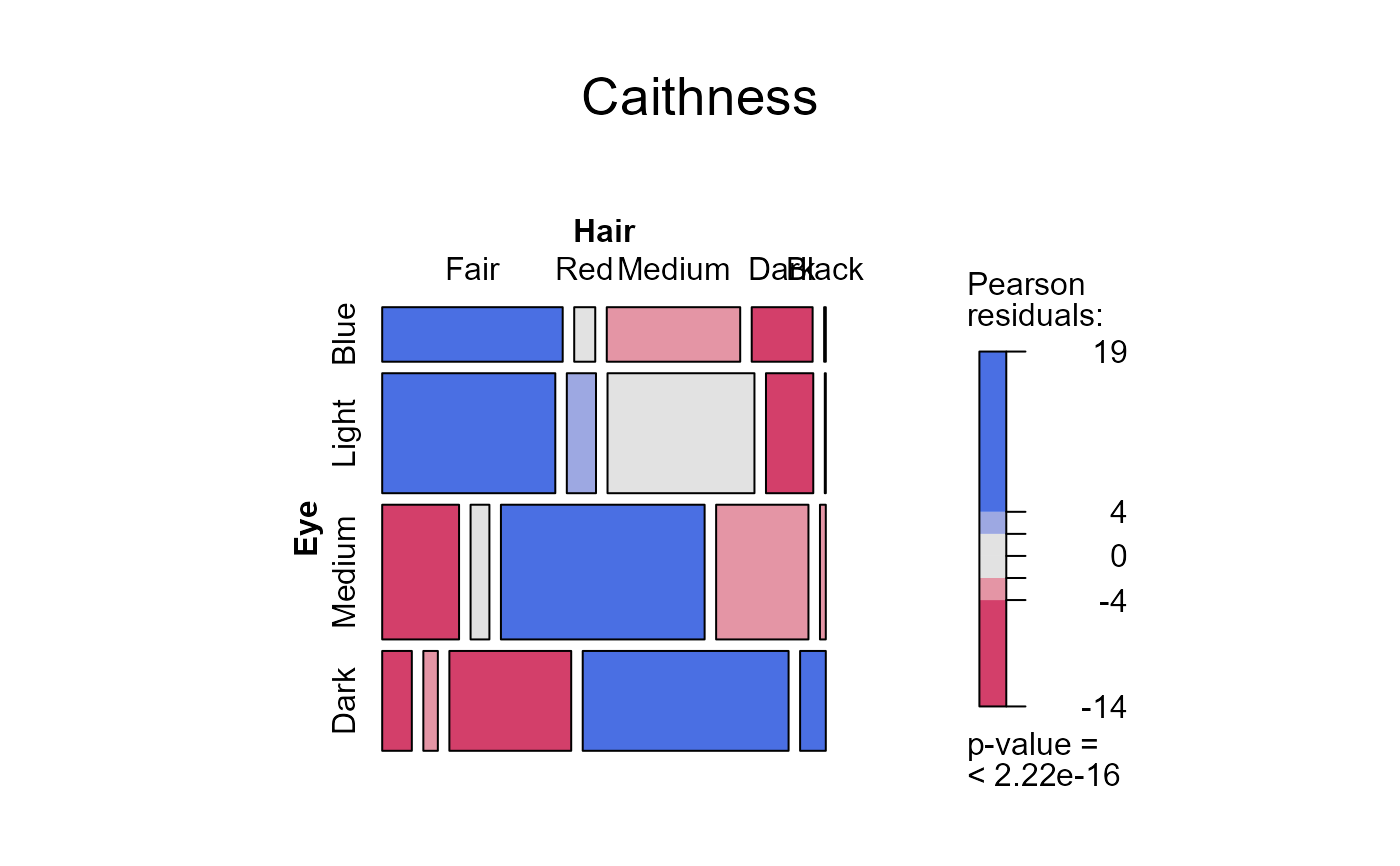
mosaic(HairEyePlace[,,1], shade=TRUE, main="Caithness")
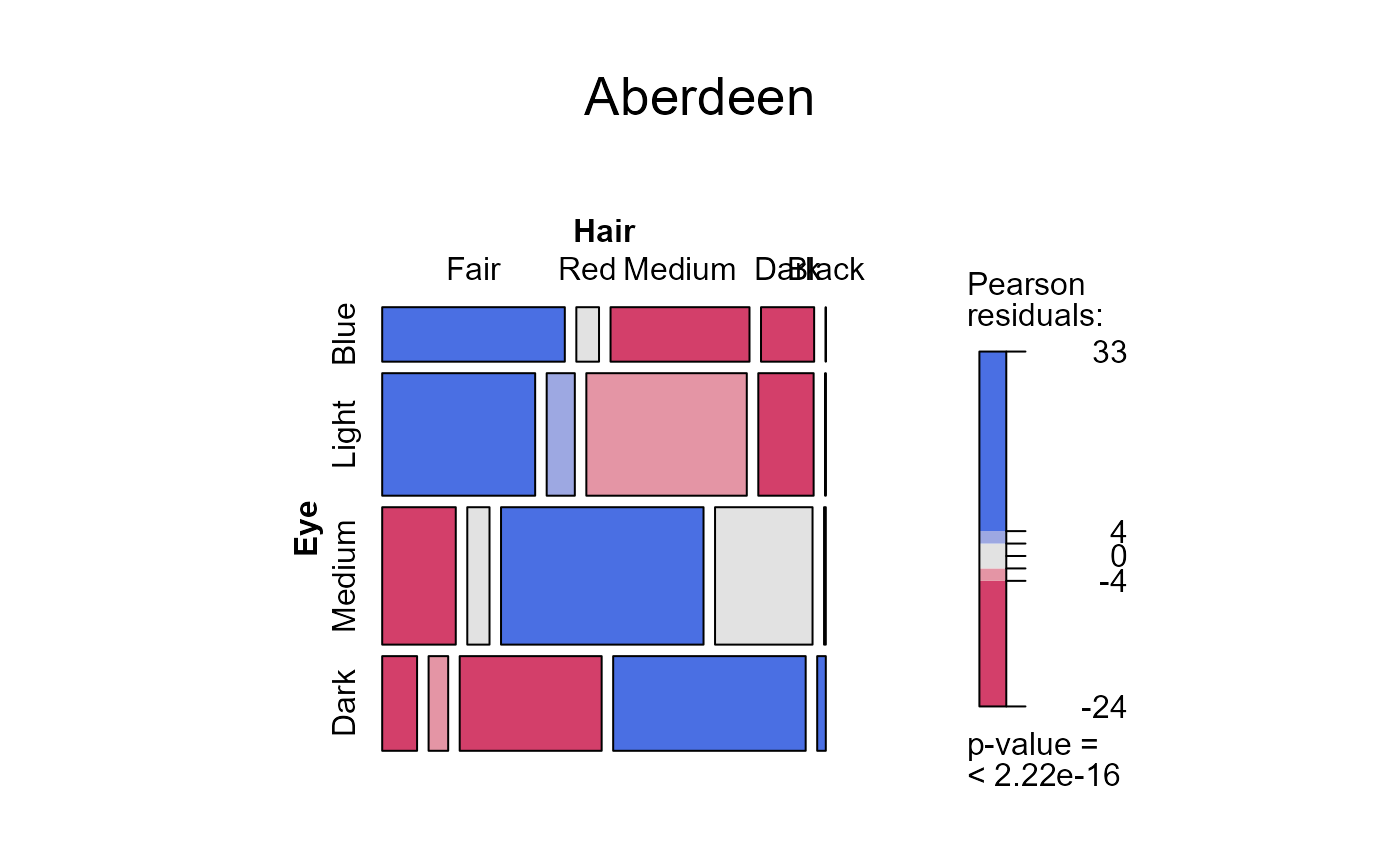
 mosaic(HairEyePlace[,,2], shade=TRUE, main="Aberdeen")
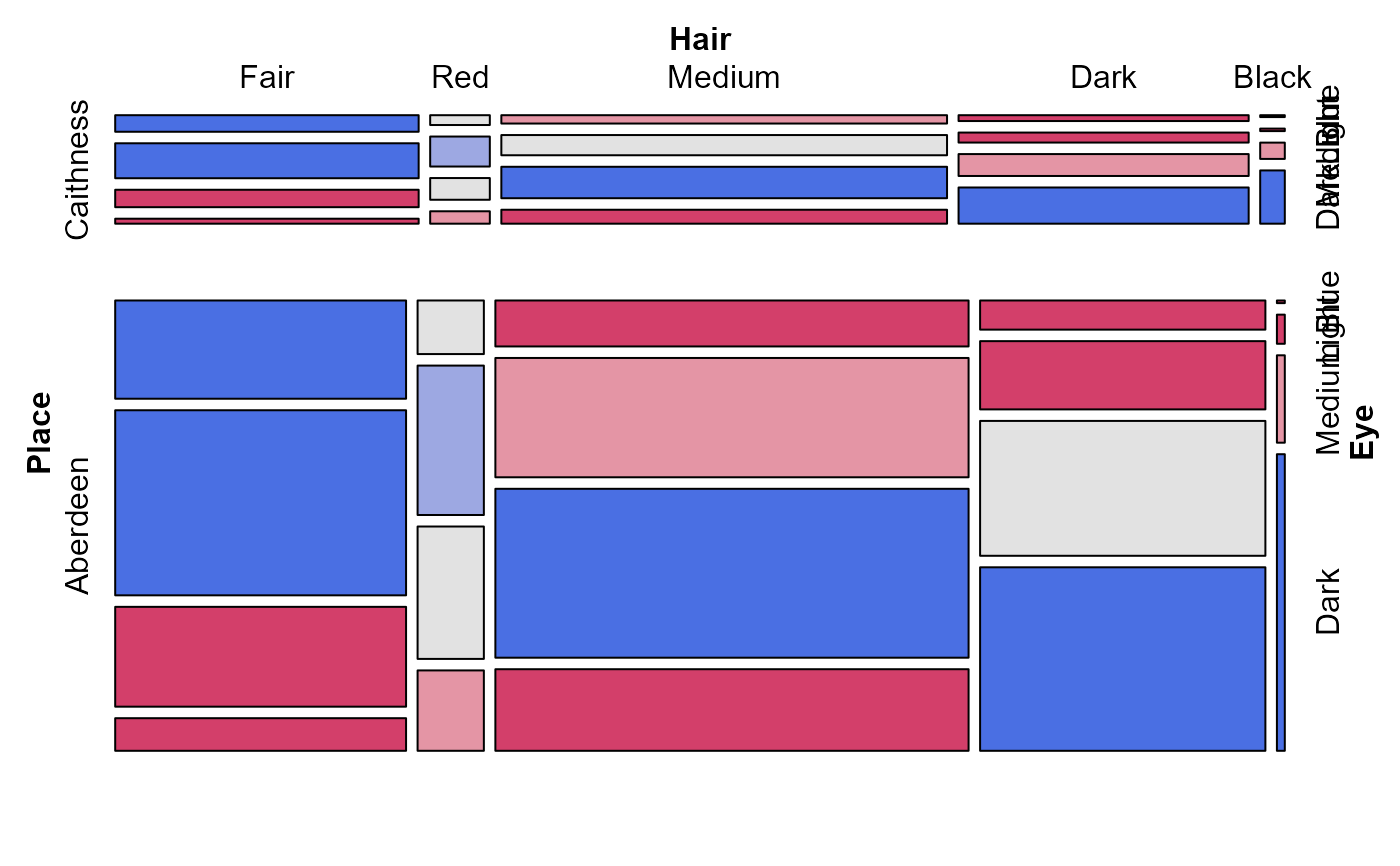
 # condition on Place
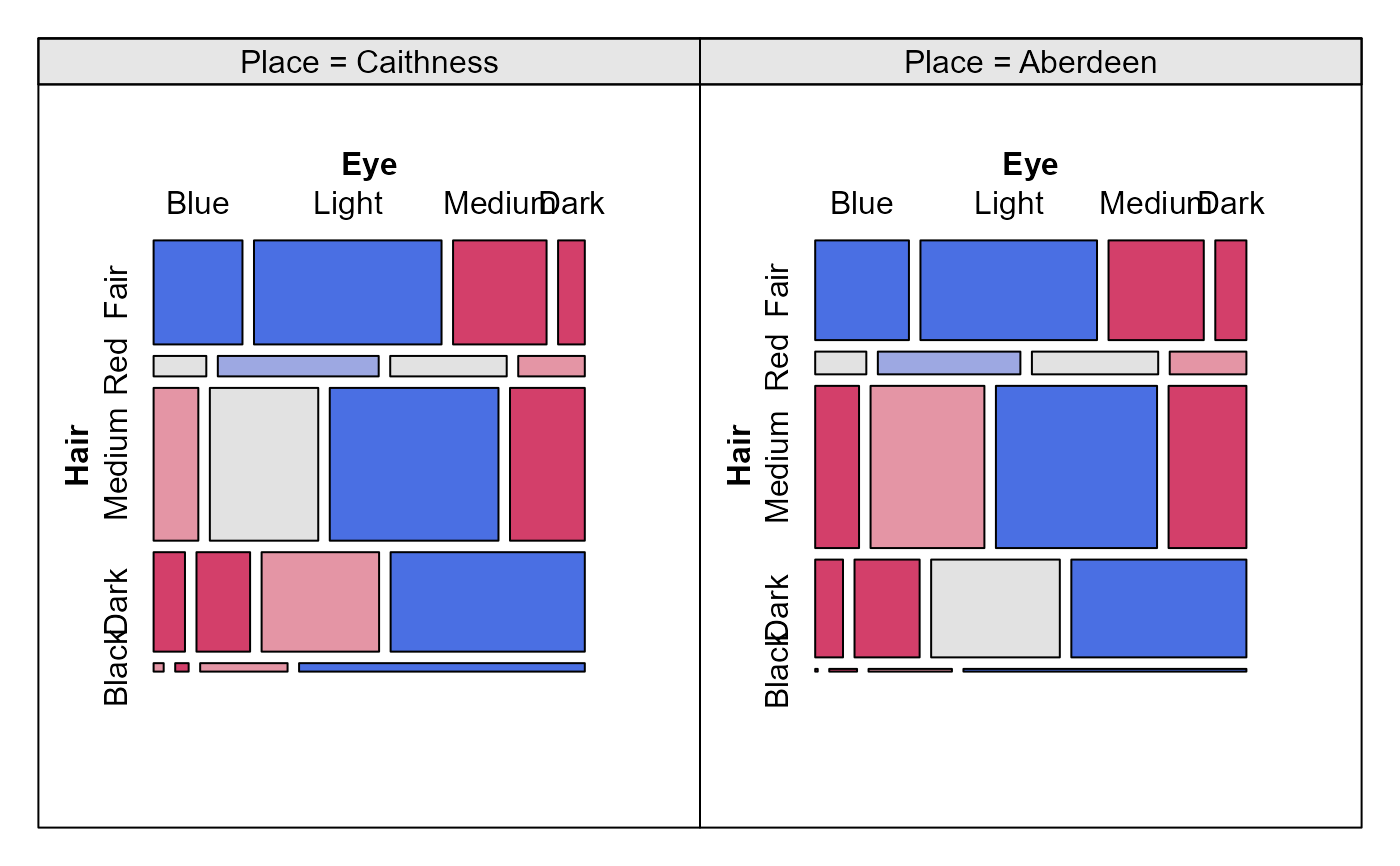
mosaic(~Hair + Eye |Place, data=HairEyePlace, shade=TRUE, legend=FALSE)
# condition on Place
mosaic(~Hair + Eye |Place, data=HairEyePlace, shade=TRUE, legend=FALSE)
 cotabplot(~Hair+Eye|Place, data=HairEyePlace, shade=TRUE, legend=FALSE)