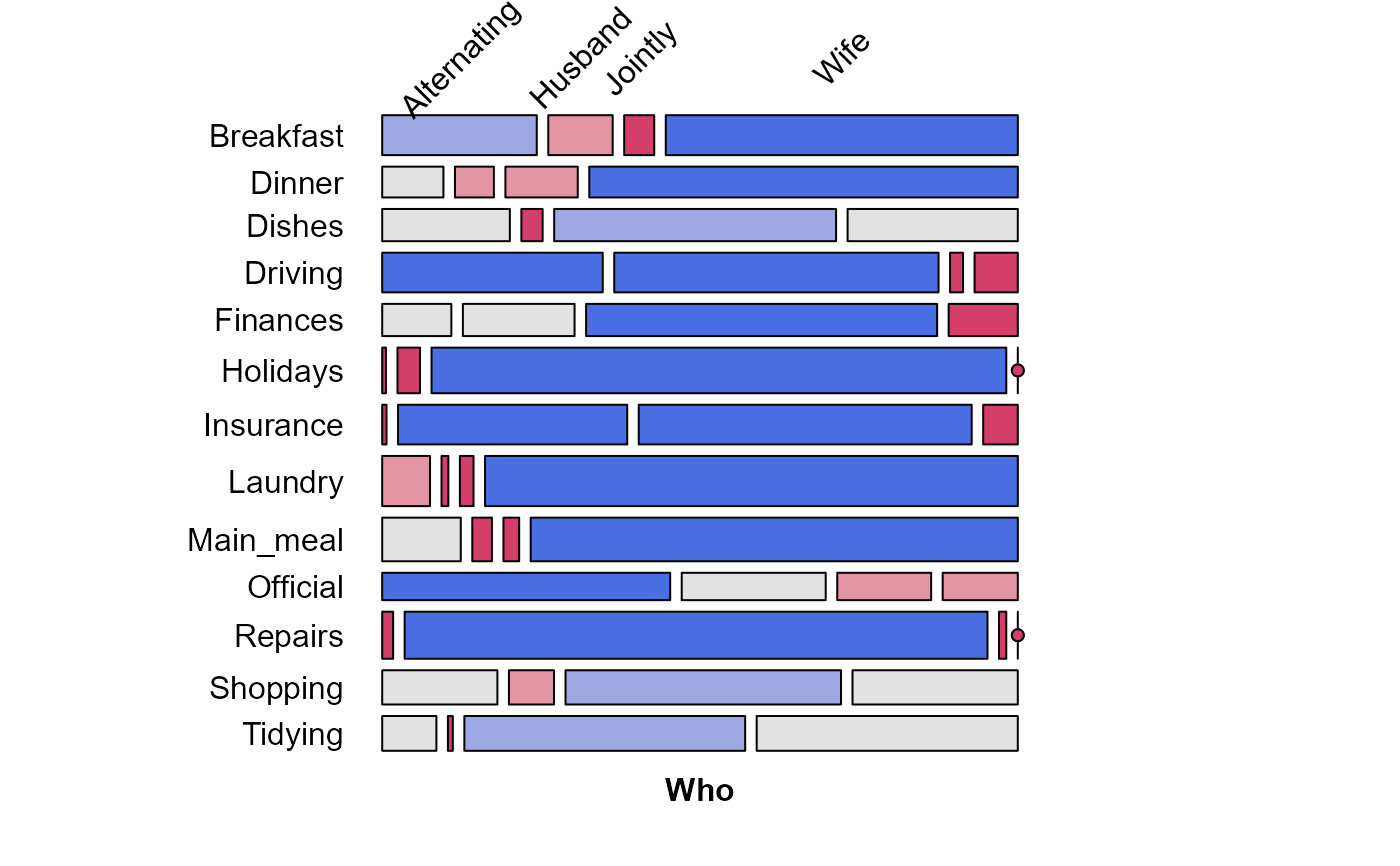
A 13 x 4 table of frequencies of household tasks performed by couples,
either by the Husband, Wife, Alternating or Jointly.
Format
The format is:
  'table' int [1:13, 1:4] 36 11 24 51 13 1 1 14 20 46 ...
- attr(*, "dimnames")=List of 2
..$ Task: chr [1:13] "Breakfast" "Dinner" "Dishes" "Driving" ...
..$ Who : chr [1:4] "Alternating" "Husband" "Jointly" "Wife"
Source
This data set was taken from housetasks, a
13 x 4 data.frame. In this table version, the rows and columns were sorted
alphabetically (and a typo was corrected).
Examples
data(HouseTasks)
str(HouseTasks)
#>  'table' int [1:13, 1:4] 36 11 24 51 13 1 1 14 20 46 ...
#>  - attr(*, "dimnames")=List of 2
#>   ..$ Task: chr [1:13] "Breakfast" "Dinner" "Dishes" "Driving" ...
#>   ..$ Who : chr [1:4] "Alternating" "Husband" "Jointly" "Wife"

chisq.test(HouseTasks)
#>
#> 	Pearson's Chi-squared test
#>
#> data:  HouseTasks
#> X-squared = 1944.5, df = 36, p-value < 2.2e-16
#>

# mosaic plot, illustrating some tweaks to handle overlapping labels
require(vcd)
mosaic(HouseTasks, shade = TRUE,
       labeling = labeling_border(rot_labels = c(45,0, 0, 0),
                                  offset_label =c(.5,5,0, 0),
                                  varnames = c(FALSE, TRUE),
                                  just_labels=c("center","right"),
                                  tl_varnames = FALSE),
       legend = FALSE)


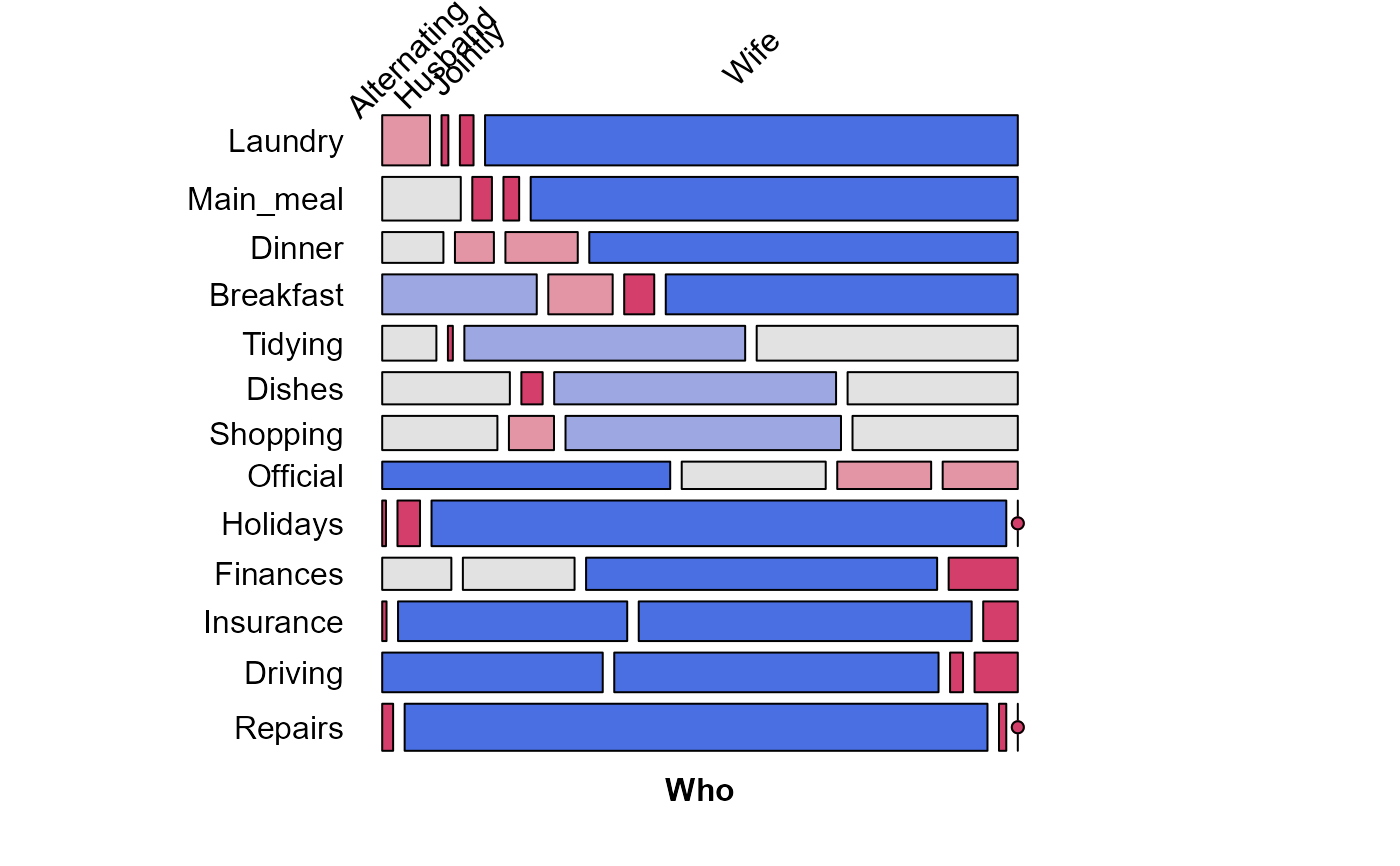
# use seriation package to permute rows & cols using correspondence analysis
if(require(seriation)) {
order <- seriate(HouseTasks, method = "CA")
# the permuted row and column labels
rownames(HouseTasks)[order[[1]]]
colnames(HouseTasks)[order[[2]]]

# do the permutation
HT_perm <- permute(HouseTasks, order, margin=1)

mosaic(HT_perm, shade = TRUE,
       labeling = labeling_border(rot_labels = c(45,0, 0, 0),
                                  offset_label =c(.5,5,0, 0),
                                  varnames = c(FALSE, TRUE),
                                  just_labels=c("center","right"),
                                  tl_varnames = FALSE),
       legend = FALSE)
}
#> Loading required package: seriation

