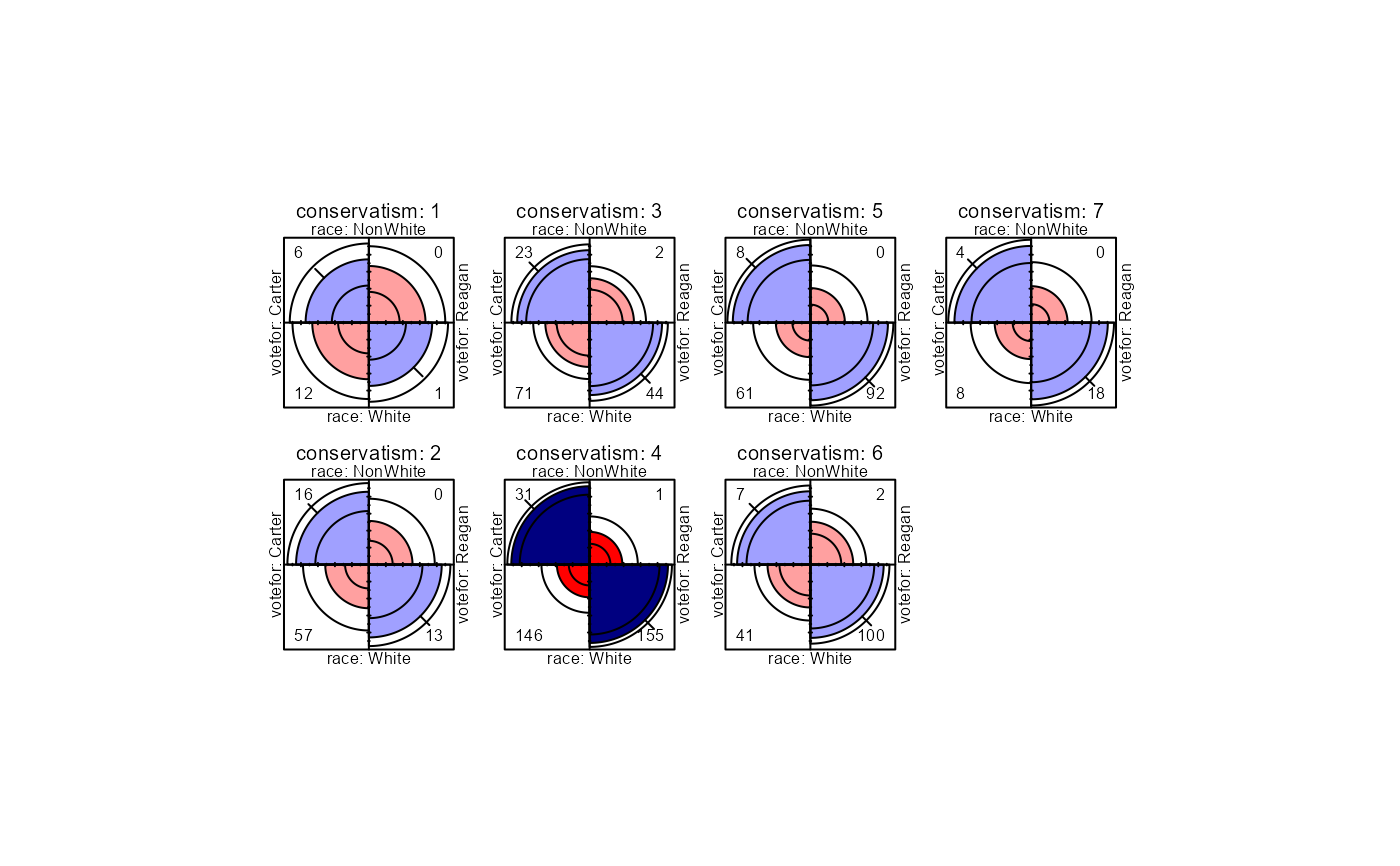
Data from the 1982 General Social Survey on votes in the 1980 U.S. presidential election in relation to race and political conservatism.
Format
A frequency data frame representing a 2 x 7 x 2 table, with 28 observations on the following 4 variables.
racea factor with levels
NonWhiteWhiteconservatisma factor with levels
1234567,1=most liberal,7=most conservativevotefora factor with levels
CarterReagan;Carterrepresents Jimmy Carter or other.Freqa numeric vector
Source
Clogg, C. & Shockey, J. W. (1988). In Nesselroade, J. R. & Cattell, R. B. (ed.) Multivariate Analysis of Discrete Data, Handbook of Multivariate Experimental Psychology, New York: Plenum Press.
Details
The data contains a number of sampling zeros in the frequencies of NonWhites voting for Ronald Reagan.