glmlist creates a glmlist object containing a list of fitted
glm objects with their names. loglmlist does the same for
loglm objects.
Arguments
- ...
One or more model objects, as appropriate to the function, optionally assigned names as in
list.- object
a
"glmlist"object- result
type of the result to be returned
Value
An object of class glmlist loglmlist, just like a list, except that each model is given a name attribute.
Details
The intention is to provide object classes to facilitate model comparison,
extraction, summary and plotting of model components, etc., perhaps using
lapply or similar.
There exists a anova.glm method for glmlist
objects. Here, a coef method is also defined, collecting the
coefficients from all models in a single object of type determined by
result.
The arguments to glmlist or loglmlist are of the form
value or name=value.
Any objects which do not inherit the appropriate class glm or
loglm are excluded, with a warning.
In the coef method, coefficients from the different models are
matched by name in the list of unique names across all models.
See also
The function llist in package Hmisc is
similar, but perplexingly more general.
The function anova.glm also handles glmlist objects
LRstats gives LR statistics and tests for a glmlist
object.
Other glmlist functions:
Kway(),
LRstats(),
get_model(),
mosaic.glmlist()
Other loglinear models:
assoc_graph(),
get_model(),
joint(),
plot.assoc_graph(),
seq_loglm()
Examples
data(Mental)
indep <- glm(Freq ~ mental+ses,
family = poisson, data = Mental)
Cscore <- as.numeric(Mental$ses)
Rscore <- as.numeric(Mental$mental)
coleff <- glm(Freq ~ mental + ses + Rscore:ses,
family = poisson, data = Mental)
roweff <- glm(Freq ~ mental + ses + mental:Cscore,
family = poisson, data = Mental)
linlin <- glm(Freq ~ mental + ses + Rscore:Cscore,
family = poisson, data = Mental)
# use object names
mods <- glmlist(indep, coleff, roweff, linlin)
names(mods)
#> [1] "indep" "coleff" "roweff" "linlin"
# assign new names
mods <- glmlist(Indep=indep, Col=coleff, Row=roweff, LinxLin=linlin)
names(mods)
#> [1] "Indep" "Col" "Row" "LinxLin"
LRstats(mods)
#> Likelihood summary table:
#> AIC BIC LR Chisq Df Pr(>Chisq)
#> Indep 209.59 220.19 47.418 15 3.155e-05 ***
#> Col 179.00 195.50 6.829 10 0.7415
#> Row 174.45 188.59 6.281 12 0.9013
#> LinxLin 174.07 185.85 9.895 14 0.7698
#> ---
#> Signif. codes: 0 ‘***’ 0.001 ‘**’ 0.01 ‘*’ 0.05 ‘.’ 0.1 ‘ ’ 1
coef(mods, result='data.frame')
#> Indep Col Row LinxLin
#> (Intercept) 4.18756842 4.8631072 4.7061332 3.37942319
#> mental.L 0.04507501 0.6795332 -0.6818052 -0.66051890
#> mental.Q -0.30073728 -0.3233129 -0.3277282 -0.32176183
#> mental.C 0.39412292 0.3936983 0.1992104 0.39415885
#> ses.L -0.04968094 -1.0342736 0.5629992 -0.99933120
#> ses.Q -0.30335318 -0.5581022 -0.3328887 -0.33029582
#> ses.C -0.19797985 -0.1707521 -0.1979530 -0.19811915
#> ses^4 0.17490822 0.1230409 0.1749295 0.17494245
#> ses^5 0.14682648 0.2429662 0.1468266 0.14682693
#> ses1:Rscore NA -0.4459213 NA NA
#> ses2:Rscore NA -0.4594090 NA NA
#> ses3:Rscore NA -0.3342208 NA NA
#> ses4:Rscore NA -0.2814884 NA NA
#> ses5:Rscore NA -0.1393421 NA NA
#> ses6:Rscore NA NA NA NA
#> mentalWell:Cscore NA NA -0.3068185 NA
#> mentalMild:Cscore NA NA -0.1617300 NA
#> mentalModerate:Cscore NA NA -0.1433864 NA
#> mentalImpaired:Cscore NA NA NA NA
#> Rscore:Cscore NA NA NA 0.09068661
#extract model components
unlist(lapply(mods, deviance))
#> Indep Col Row LinxLin
#> 47.417847 6.829334 6.280761 9.895124
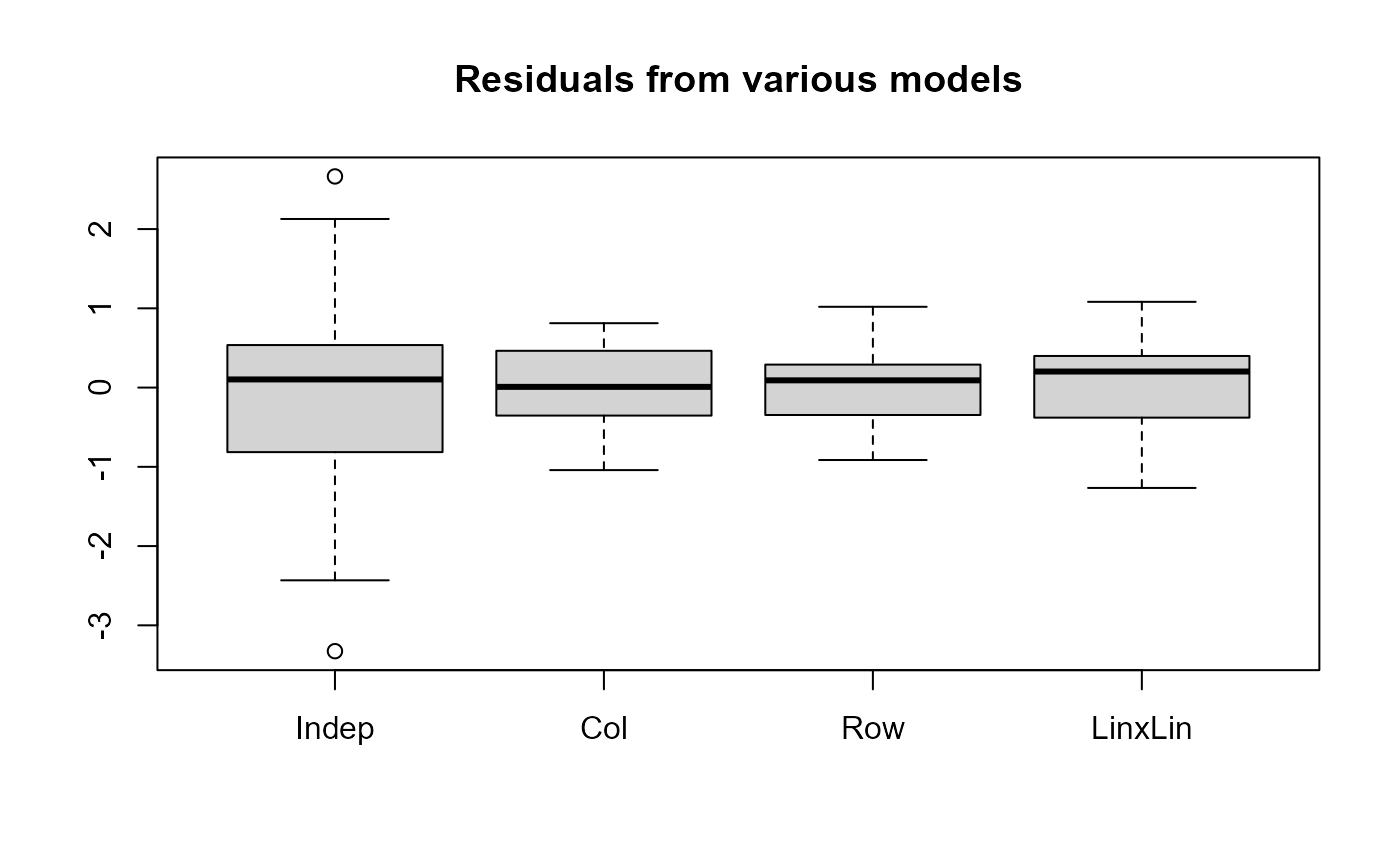
res <- lapply(mods, residuals)
boxplot(as.data.frame(res), main="Residuals from various models")