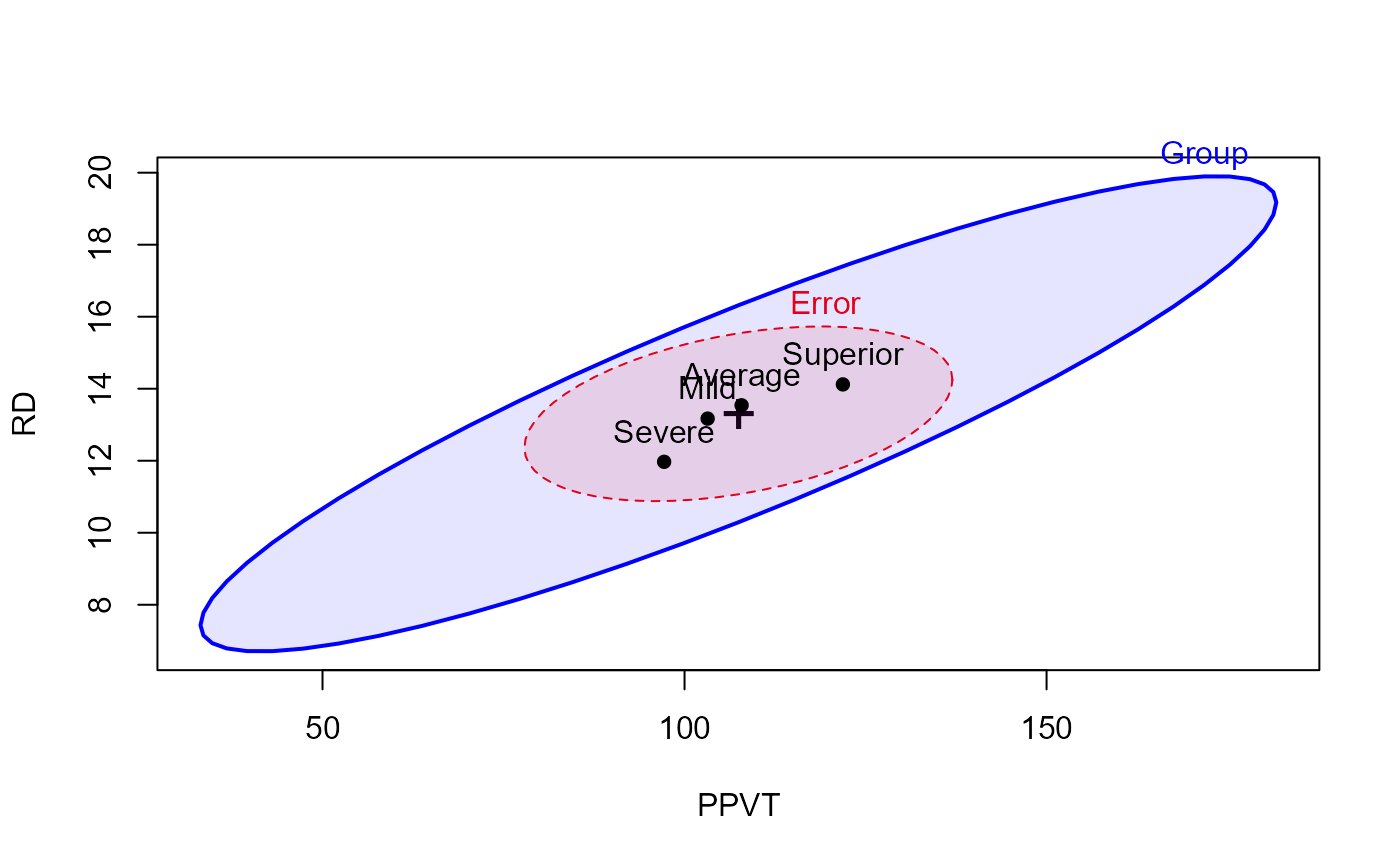
Six cognitive/achievement test scores for children classified into four
reading-achievement groups (Severe, Mild, Average, Superior),
reconstructed from the group means, standard deviations, and pooled
within-cells correlations reported as a worked "real data example" in
Bray & Maxwell (1985), Table 2.3.
Individual rows are simulated, not the original observations: only
group-level summary statistics were published, with no raw data and no
per-group correlations (a single correlation matrix, pooled across all
four groups, was reported). Each group was drawn from a multivariate
normal with that group's reported means and a covariance matrix built
from that group's reported SDs combined with the pooled correlations,
then forced to match those exact moments via
MASS::mvrnorm(..., empirical = TRUE). Summarizing this data frame by
Group exactly reproduces Bray & Maxwell's Table 2.3 (see
data-raw/ReadingDisability.R).
B&M (p.38) describe the six measures as follows: "The PPVT is a general verbal measure of IQ, whereas the VF and SIM tests are verbal criteria. The EF taps higher-order nonverbal abilities, whereas the VMI and RD are general nonverbal measures."
Usage
data("ReadingDisability")Format
A data frame with 571 observations on the following 7 variables, a
4-level between-subjects factor (Group) with unequal n.
GroupReading achievement level, an ordered factor with levels (worst to best)
Severe(n = 93) <Mild(n = 113) <Average(n = 274) <Superior(n = 91)PPVTPeabody Picture Vocabulary Test score – a general verbal measure of IQ, numeric
RDRecognition-Discrimination Test score – a general nonverbal measure, numeric
EFEmbedded Figures Test score – taps higher-order nonverbal abilities, numeric
VFVerbal Fluency Test score – a verbal criterion measure, numeric
VMIBeery Visual-Motor Integration Test score – a general nonverbal measure, numeric
SIMSimilarities subtest of the Wechsler Preschool and Primary Scale of Intelligence (WPPSI) score – a verbal criterion measure, numeric
Source
Bray, J. H., & Maxwell, S. E. (1985). Multivariate Analysis of Variance. Sage. Table 2.3, p.38, "Means, Standard Deviations, and Within-Cells Correlations for Real Data Example."
B&M attribute this table to Fletcher, J. M., & Satz, P. (1980), but that reference does not appear in B&M's own References section – a gap in the source book, not (so far as we can tell) a typo on our part. A copy of Fletcher, J. M., & Satz, P. (1980), Developmental changes in the neuropsychological correlates of reading achievement: A six-year longitudinal follow-up, Journal of Clinical Neuropsychology, 2(1), 23-37, is available, but its own reported variables differ from the six tabulated here – so it is not confirmed to be the exact source of Table 2.3, only the most likely candidate (same authors, matching year, matching four-group reading-disability design). Treat the B&M attribution as unresolved pending a source that actually contains these six measures.
Examples
data(ReadingDisability)
str(ReadingDisability)
#> 'data.frame':	571 obs. of  7 variables:
#>  $ Group: Ord.factor w/ 4 levels "Severe"<"Mild"<..: 1 1 1 1 1 1 1 1 1 1 ...
#>  $ PPVT : num  77.6 101.6 91.2 118.1 103.6 ...
#>  $ RD   : num  10.9 15.2 10.3 13.5 15.3 ...
#>  $ EF   : num  9.77 11.54 4.81 7.11 10.05 ...
#>  $ VF   : num  31 37.2 17.5 26 26.2 ...
#>  $ VMI  : num  61.6 94.5 75.1 56.8 72.7 ...
#>  $ SIM  : num  14 15.5 18.4 15.9 13.9 ...

rd.mod <- lm(cbind(PPVT, RD, EF, VF, VMI, SIM) ~ Group,
             data = ReadingDisability)
car::Anova(rd.mod)
#>
#> Type II MANOVA Tests: Pillai test statistic
#>       Df test stat approx F num Df den Df    Pr(>F)
#> Group  3   0.42234   15.401     18   1692 < 2.2e-16 ***
#> ---
#> Signif. codes:  0 '***' 0.001 '**' 0.01 '*' 0.05 '.' 0.1 ' ' 1

heplot(rd.mod, fill = TRUE, fill.alpha = 0.1)