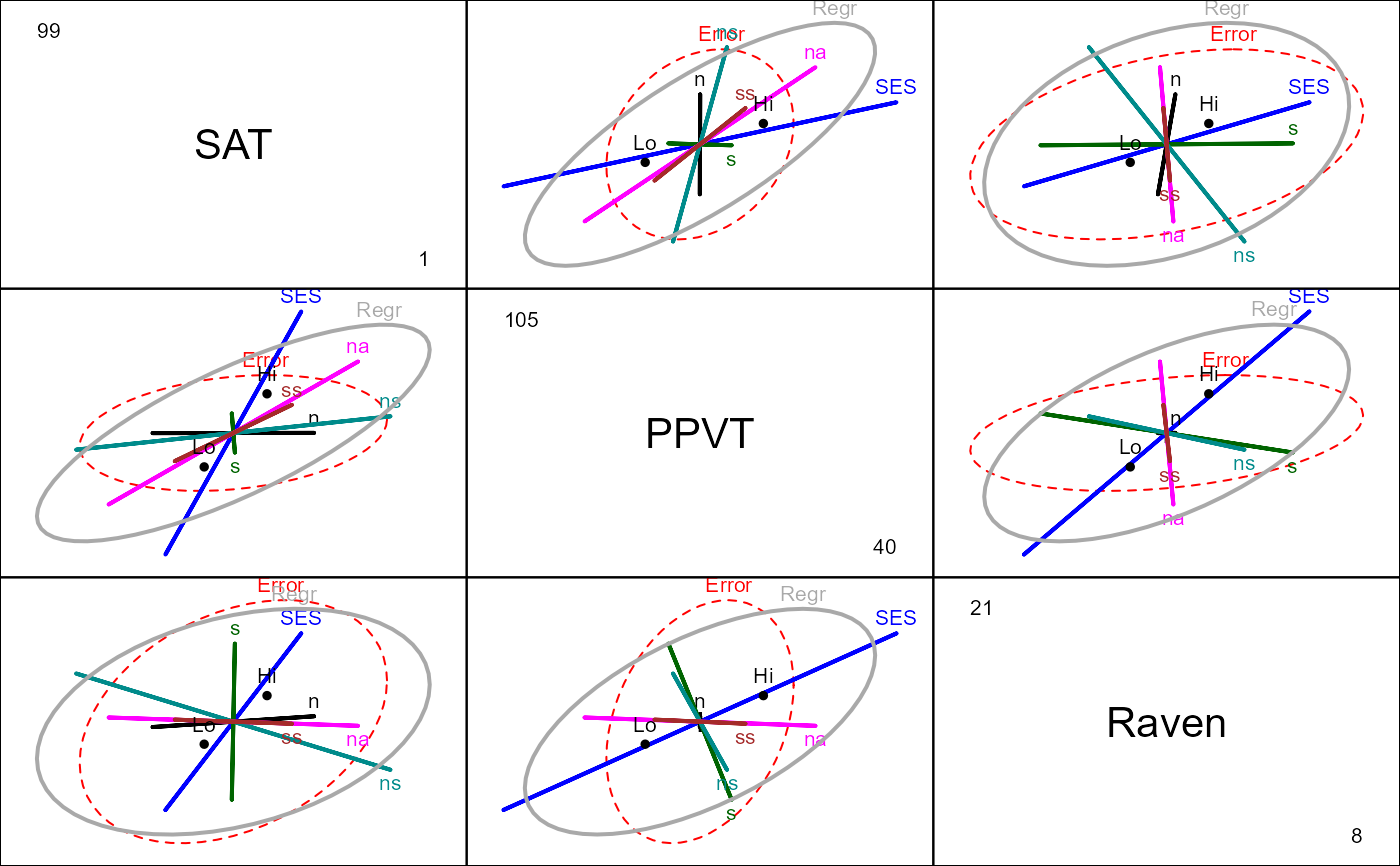
The function (in the form of an mlm method for the generic
pairs function) constructs a “matrix” of pairwise
HE plots (see heplot) for a multivariate linear model.
Arguments
- x
an object of class
mlm.- variables
indices or names of the three of more response variables to be plotted; defaults to all of the responses.
- var.labels
labels for the variables plotted in the diagonal panels; defaults to names of the response variables.
- var.cex
character expansion for the variable labels.
- type
type of sum-of-squares-and-products matrices to compute; one of
"II","III","2", or"3", where"II"is the default (and"2"is a synonym).- idata
an optional data frame giving a factor or factors defining the intra-subject model for multivariate repeated-measures data. See Details of
Anovafor an explanation of the intra-subject design and for further explanation of the other arguments relating to intra-subject factors.- idesign
a one-sided model formula using the “data” in idata and specifying the intra-subject design for repeated measure models.
- icontrasts
names of contrast-generating functions to be applied by default to factors and ordered factors, respectively, in the within-subject “data”; the contrasts must produce an intra-subject model matrix in which different terms are orthogonal. The default is c("contr.sum", "contr.poly").
- imatrix
In lieu of
idataandidesign, you can specify the intra-subject design matrix directly viaimatrix, in the form of list of named elements. Each element gives the columns of the within-subject model matrix for an intra-subject term to be tested, and must have as many rows as there are responses; the columns of the within-subject model matrix for different terms must be mutually orthogonal.- iterm
For repeated measures designs, you must specify one intra-subject term (a character string) to select the SSPE (E) matrix used in the HE plot. Hypothesis terms plotted include the
itermeffect as well as all interactions ofitermwithterms.- manova
optional
Anova.mlmobject for the model; if absent a MANOVA is computed. Specifying the argument can therefore save computation in repeated calls.- offset.axes
proportion to extend the axes in each direction; defaults to 0.05.
- digits
number of significant digits in axis end-labels; taken from the
"digits"option.- fill
A logical vector indicating whether each ellipse should be filled or not. The first value is used for the error ellipse, the rest — possibly recycled — for the hypothesis ellipses; a single fill value can be given. Defaults to FALSE for backward compatibility. See Details of
heplot- fill.alpha
Alpha transparency for filled ellipses, a numeric scalar or vector of values within
[0,1], where 0 means fully transparent and 1 means fully opaque. Defaults to 0.3.- ...
arguments to pass down to
heplot, which is used to draw each panel of the display.
References
Friendly, M. (2006). Data Ellipses, HE Plots and Reduced-Rank Displays for Multivariate Linear Models: SAS Software and Examples Journal of Statistical Software, 17(6), 1-42. https://www.jstatsoft.org/v17/i06/
Friendly, M. (2007). HE plots for Multivariate General Linear Models. Journal of Computational and Graphical Statistics, 16(2) 421-444. http://datavis.ca/papers/jcgs-heplots.pdf
See also
Other HE plot functions:
heplot(),
heplot1d(),
heplot3d()