label.ellipse is used to a draw text label on an ellipse at its center or
somewhere around the periphery in a very flexible way. It is used in heplot, covEllipses, and
coefplot.mlm, but is also useful as a utility when plotting ellipses in base R graphics.
Arguments
- ellipse
A two-column matrix of coordinates for the ellipse boundary, for example as computed by
ellipse.- label
Character string to be used as the ellipse label
- col
Label color
- label.pos
Label position relative to the ellipse. See details
- xpd
Should the label be allowed to extend beyond the plot limits?
- tweak
A vector of two lengths used to tweak label positions. Only used for label positions
1:4or corresponding character or compass directions. The defaults are 0.5 times the height and width of the character"M"added or subtracted to the calculated (x, y) values.- ...
Other parameters passed to
text, e.g.,cex,col, ...
Value
Mainly used for its side-effect of producing a call to text, but also returns, invisibly,
the (x, y) coordinates where the label was placed.
Details
The function takes the coordinates of the input ellipse and uses that, together with label.pos to calculate the
(x, y) coordinates to be passed to text along with a computed pos argument.
The values of tweak are applied to (x, y) to position the labels to the outside of the ellipse by default.
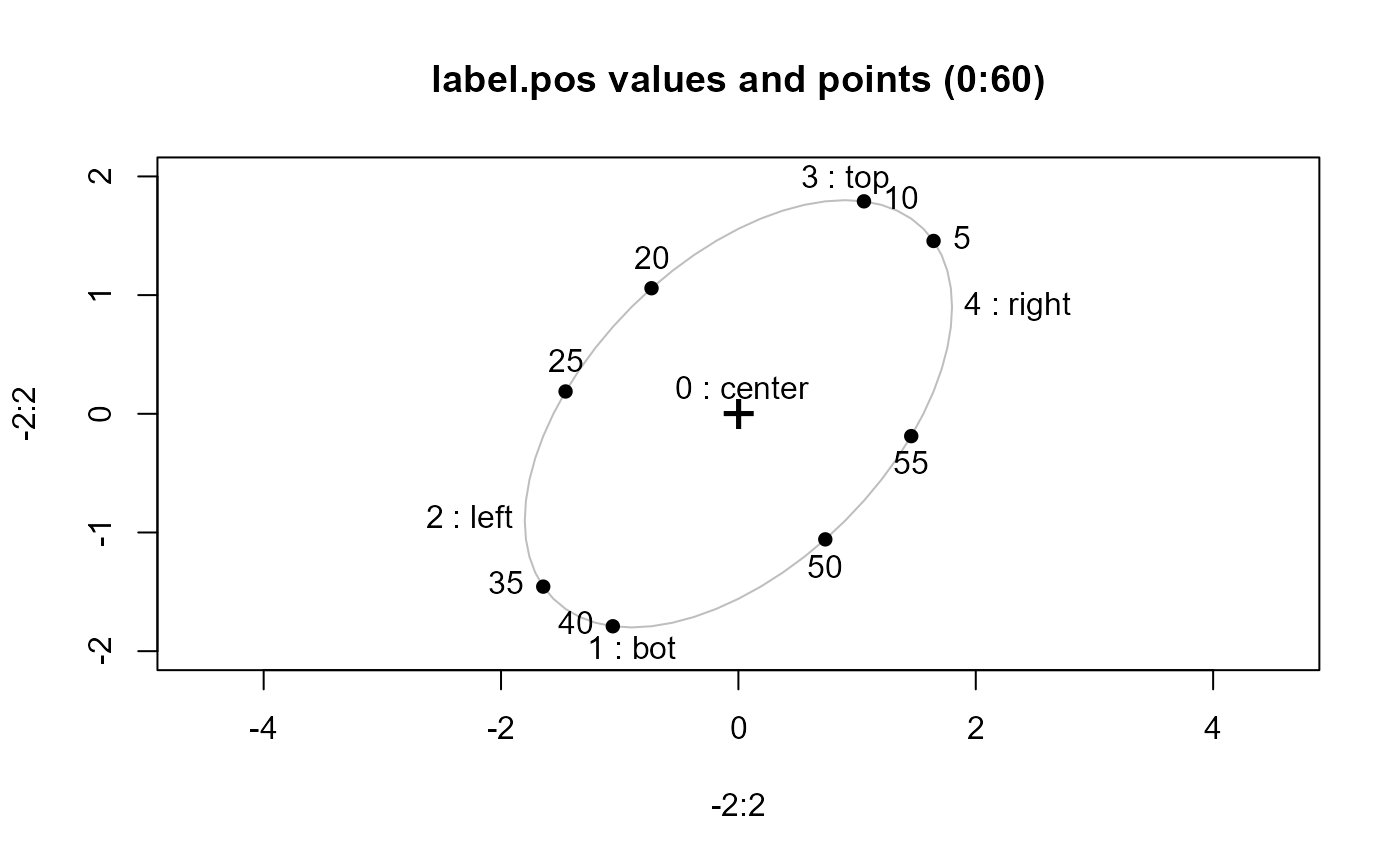
The label.pos argument implements a very general way to position the text label with respect to the ellipse:
If
label.pos = NULL(the default), the function uses the sign of the correlation \(r\) represented by the ellipse to determine a position at the "top" (\(r >= 0\)) or "bottom" (\(r < 0\)) of the ellipse.Integer values of 0, 1, 2, 3 and 4, respectively indicate positions at the center, below, to the left of, above and to the right of the max/min coordinates of the
ellipse, where the values1:4correspond to the usual values ofposintext.Label positions can also be specified as the corresponding character strings
c("center", "bottom", "left", "top", "right"), or compass directions,c("C", "S", "W", "N", "E"). Additionally, diagonal compass directionsc("NE", "SE", "SW", "NW")can be used, corresponding to angles 45, 135, 225, and 315 degrees, clockwise from 0 at North.Even more generally,
label.poscan also be a fraction in (0,1), interpreted as the fraction of the way around the unit circle, counterclockwise from the North point (0, 1).
Examples
# Helper, to compute a circle
circle <- function(center=c(0,0), radius=1, segments=60) {
angles <- (0:segments)*2*pi/segments
circle <- radius * cbind( cos(angles), sin(angles))
t( c(center) + t( circle ))
}
# Create a circular ellipse
circ <- circle(radius=1.5)
plot(-2:2, -2:2,
type="n", asp=1,
main="Compass Directions on Circle\n(Cardinal + Diagonal)")
lines(circ, col="gray", lwd=2)
points(0, 0, pch="+", cex=2)
# Cardinal directions
cardinal <- c("N", "E", "S", "W")
for (pos in cardinal) {
label.ellipse(circ, label=pos, label.pos=pos, col="red", cex=1.2, font=2)
}
# Diagonal directions (recently added)
diagonal <- c("NE", "SE", "SW", "NW")
for (pos in diagonal) {
label.ellipse(circ, label=pos, label.pos=pos, col="blue", cex=1.2, font=2)
}
# Center, & illustrate return
xy <- label.ellipse(circ, label="C", label.pos="C", col="darkgreen", cex=1.2, font=2)
xy
#> x y
#> 0.02459016 -0.05593923
# Add reference lines to show the angles
abline(h=0, v=0, col="lightgray", lty=2)
abline(a=0, b=1, col="lightgray", lty=2) # 45° line
abline(a=0, b=-1, col="lightgray", lty=2) # -45° line
legend("bottomleft",
legend=c("Cardinal (N,E,S,W)", "Diagonal (NE,SE,SW,NW)", "Center"),
col=c("red", "blue", "darkgreen"),
lwd=2, bty="n")
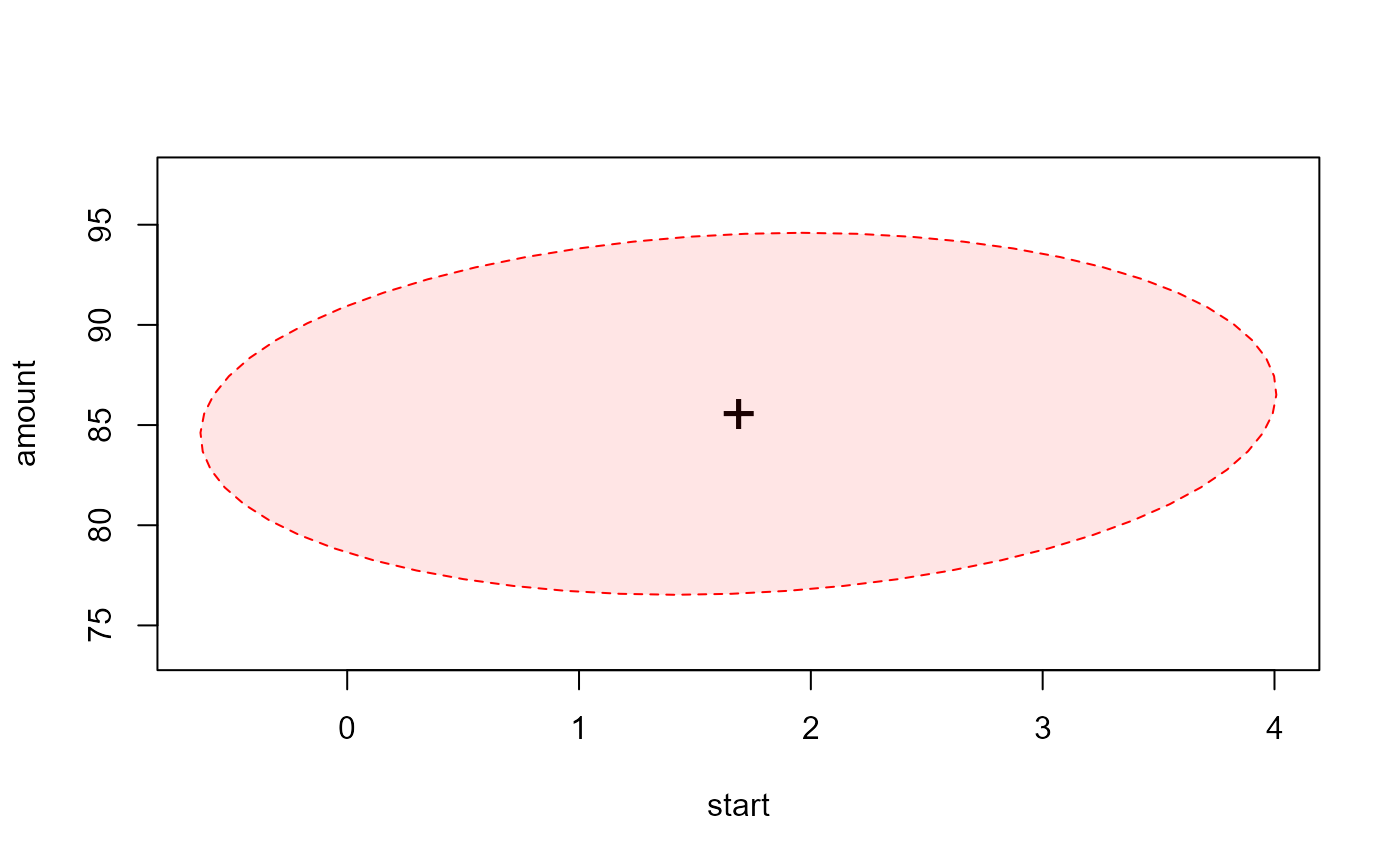
 # Use in `heplot()`
data(dogfood, package = "heplots")
dogfood.mod <- lm(cbind(start, amount) ~ formula, data=dogfood)
# default: top or bottom, depending on sign of the ellipse
heplot(dogfood.mod,
fill = TRUE, fill.alpha = 0.1)
# Use in `heplot()`
data(dogfood, package = "heplots")
dogfood.mod <- lm(cbind(start, amount) ~ formula, data=dogfood)
# default: top or bottom, depending on sign of the ellipse
heplot(dogfood.mod,
fill = TRUE, fill.alpha = 0.1)
 # change label.pos and cex
heplot(dogfood.mod,
fill = TRUE, fill.alpha = 0.1,
label.pos = c("NE", "SW"), cex = 1.4)
# change label.pos and cex
heplot(dogfood.mod,
fill = TRUE, fill.alpha = 0.1,
label.pos = c("NE", "SW"), cex = 1.4)
 # Define diagonal compass positions and their corresponding angular fractions
# translate nmemonics to standard numerical text positions 1:4,
# Define diagonal compass positions and their corresponding angular fractions
# translate nmemonics to standard numerical text positions 1:4,