Tests of multivariate models, including multivariate analysis of variance (MANOVA) for group differences and multivariate multiple regression (MMRA) can be easily visualized by plots of a hypothesis (“H”) data ellipse for the fitted values relative to the corresponding plot of the error ellipse (“E”) of the residuals, which I call the HE plot framework.
For more than a few response variables, these result can be projected onto a lower-dimensional “canonical discriminant” space providing an even simpler description.
Packages
In this chapter we use the following packages. Load them now
11.1 HE plot framework
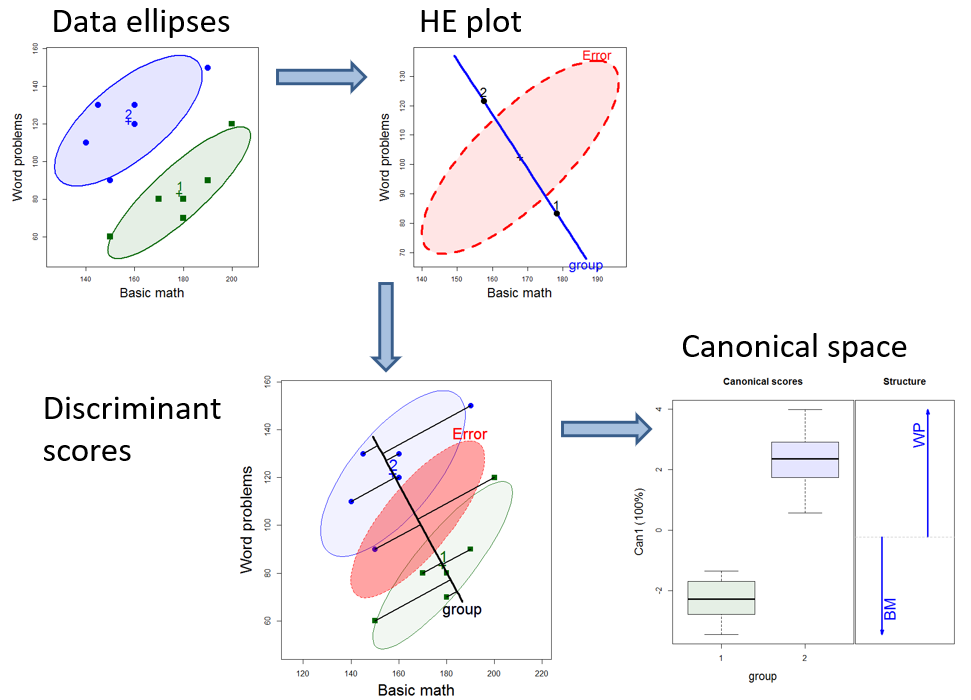
Chapter 9 illustrated the basic ideas of the framework for visualizing multivariate linear models in the context of a simple two group design, using Hotelling’s \(T^2\). These are illustrated in Figure 11.1.
In data space, each group is summarized by its data ellipse, representing the means and covariances.
Variation against the hypothesis of equal means can be seen by the \(\mathbf{H}\) ellipse in the HE plot, representing the data ellipse of the fitted values. Error variance is shown in the \(\mathbf{E}\) ellipse, representing the pooled within-group covariance matrix, \(\mathbf{S}_p\) and the data ellipse of the residuals from the model.
The MANOVA (or Hotelling’s \(T^2\)) is formally equivalent to a discriminant analysis, predicting group membership from the response variables which can be seen in data space.
This effectively projects the \(p\)-dimensional space of the predictors into the smaller canonical space that shows the greatest differences among the groups.
For more complex models such as MANOVA with multiple factors or multivariate multivariate regression, there is one \(\mathbf{H}\) ellipse for each term in the model. …
11.1.1 HE plot details
11.2 Canonical discriminant analysis
#> Writing packages to  C:/R/Projects/Vis-MLM-book/bib/pkgs.txt
#> 8  packages used here:
#>  broom, car, carData, dplyr, ggplot2, heplots, knitr, tidyr